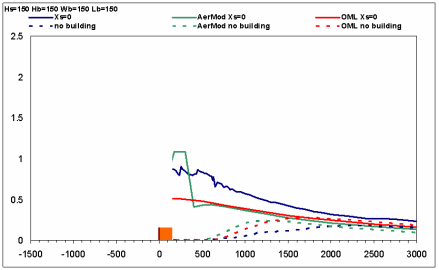
This page gives technically minded readers the possibility to explore the behavior of dispersion when a stack is placed close to a rectangular building.
Some background information is appropriate:
In 1990 a comprehensive data set on dispersion behind rectangular buildings was compiled in the US EPA wind tunnel by R.S. Thompson. The data set systematically describes dispersion for a variety of building shapes, stack heights and stack locations. These data were originally used to estimate so-called Building Amplification Factor, but the potential of the data set extends much beyond this application.
In 2006, a group at the National Environmental Research Institute in Denmark conducted a study where we used this data set to analyse the performance of a number of dispersion models with more or less sophisticated approaches for handling building effects. The models are the Danish OML model, the US AERMOD/PRIME model, and the German MISKAM model.
The study is briefly described in a conference paper for the 6th International Conference on Urban Air Quality (Cyprus, March 27-29, 2007). It is also discussed in a technical report on revision of the Danish OML model that contains numerous graphs based on the data set.
Thompson’s data set is very comprehensive, and it deserves to be used much more than it has been in the past. The present page gives relevant links, as listed below.
Olesen, H.R., Berkowicz, R.B, Ketzel, M., Løfstrøm, P., 2007a: Validation of OML, AERMOD/PRIME and MISKAM using the Thompson wind tunnel data set for simple stack-building configurations. 6th International Conference on Urban Air Quality, Cyprus, March 27-29, 2007. 4-page extended abstract at
Olesen, H.R., Berkowicz, R.B, Løfstrøm, P., 2007b: OML: Review of model formulation. National Environmental Research Institute, Denmark. NERI Technical Report No. 609, pp. 130.
Thompson, R. S. (1993): Building Amplification Factors for Sources Near Buildings - A Wind-Tunnel Study. Atmospheric Environment Part A-General Topics 27, 2313-2325.
Thompson, R.S. (1991): Data report. Project: Building Amplification Factors. Available as a scanned PDF file from the US EPA (contact Steve Perry).