In the Danish emission inventories system emissions from industrial processes and product use (IPPU) are treated separately from emissions related to fuel consumption in the industry; these are included in the Energy Sector (Stationary combustion). IPPU emissions in Denmark are divided in seven main groups of sources.
The most important pollutants in the IPPU sector in 2024 are CO2, F-gasses, NMVOC, SO2, PM2.5 and some heavy metals. The IPPU sector makes up 3.8 % of the total national emission of greenhouse gasses (incl. LULUCF); hereof 4.6 % of the CO2 emission and all of the F-gas emissions. The corresponding percentage for NMVOC, SO2 and PM2.5 are 35.7 %, 9.0 % and 6.2 %. A full list of the pollutants emitted from the IPPU sector with total 2024 emissions and the fraction of these emissions in relation to total national emissions are available in the linked Table 1. The following figures present the distribution of GHG, NMVOC, SO2 and PM2.5 emissions respectively on the individual subsectors in 2024.
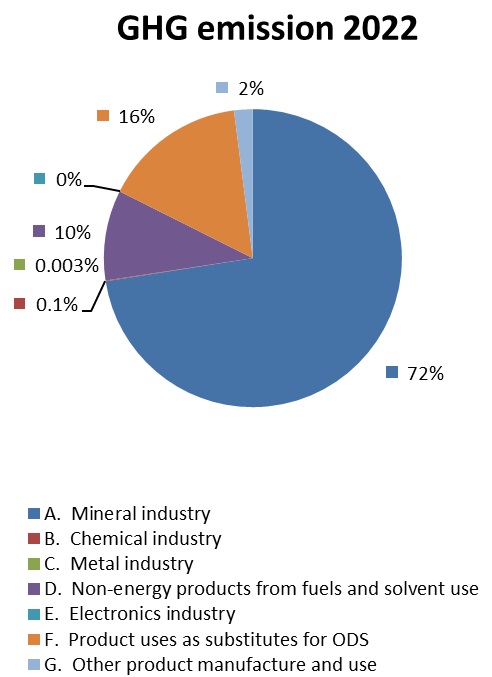
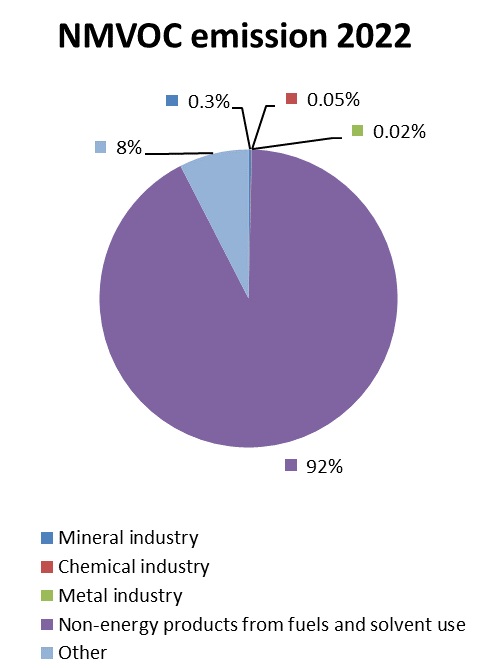
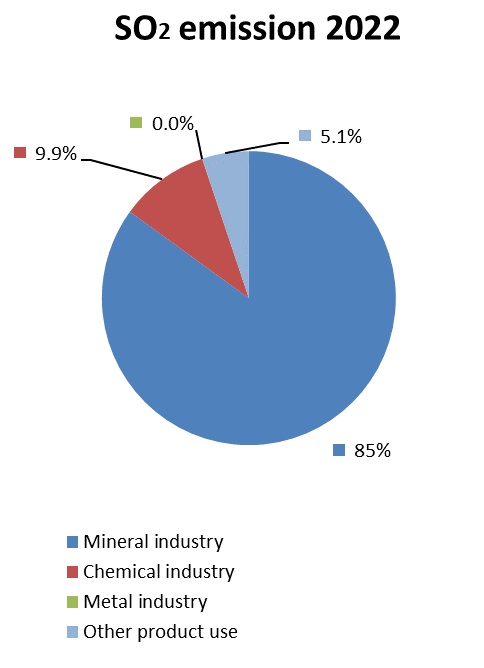
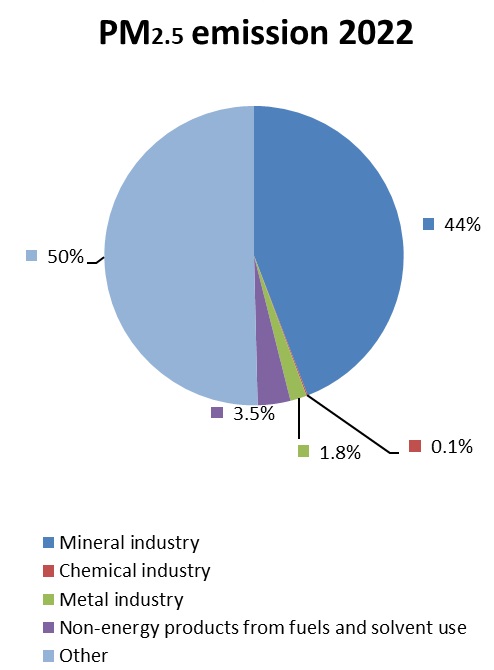
Figure 1 Distribution of the emissions from the IPPU sector.
 |  |
 |  |
For greenhouse gasses, the largest single source is cement production (A.1) with 870 kt CO2 (64 % of total IPPU GHG emission), the second largest is refrigeration and air conditioning (F.1) with 257 kt CO2e (19 % of total IPPU GHG emission).
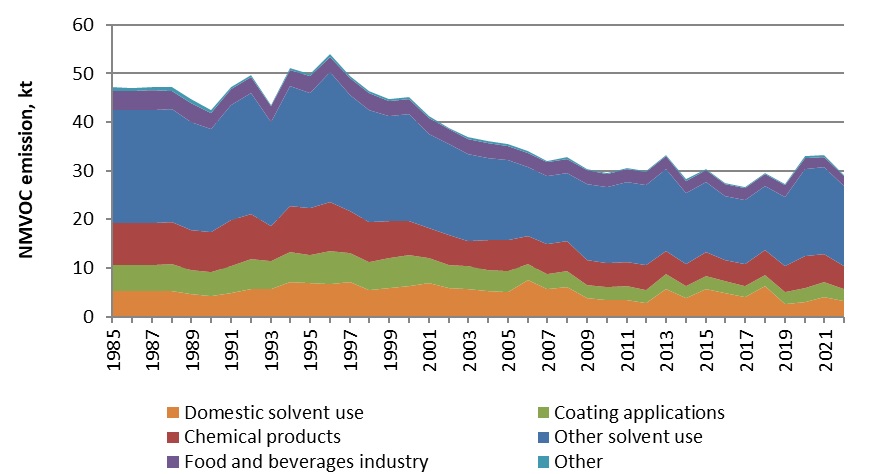
NMVOC emissions in 2024 in the IPPU sector are primarily caused by solvent use (35.2 kt, i.e. 94 % of IPPU), a smaller share from the food & beverages industry (2.2 kt, i.e. 6 %) and minor contributions from mineral industries, chemical industries, metal industries and other product uses. The largest categories for solvent use are Other solvent use (D.3i) (17.2 kt NMVOC), Coating applications (D.3d) (8.8 kt) and Domestic solvent use including fungicides (D.3a) (5.7 kt).
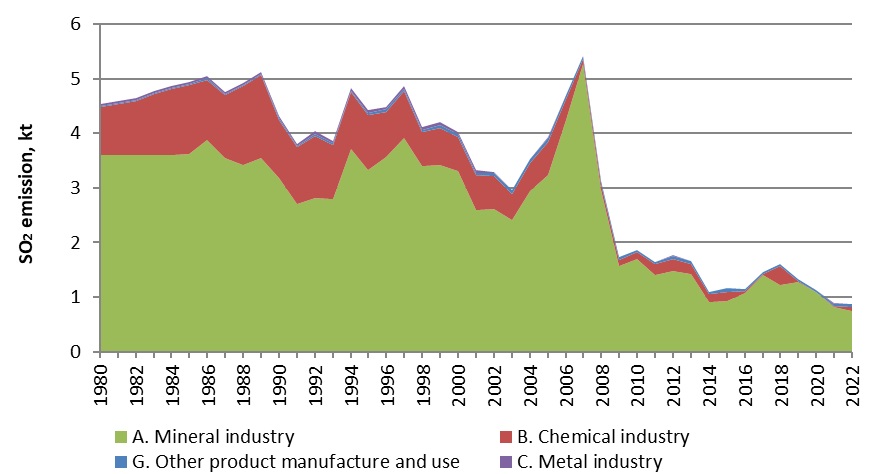
Six sources contribute to the SO2 emission in 2024. In mineral industries are contributions from production of ceramics (A.4a) (0.50 kt), stone wool production (A.4d) (0.02 kt) and glass production (A.3) (0.10 kt). In addition are contributions from other chemical industry (B.10) (10.8 t), lead production (C.5) (0.4 t) and use of other products (G.4) (16.2 t).
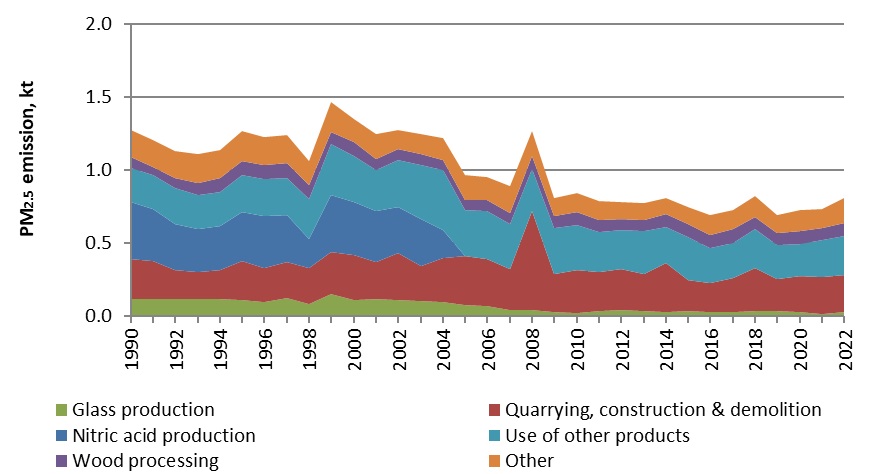
For PM2.5 emissions, the largest contributing sources are quarrying and mining of minerals other than coal (A.5a) with 124.6 t (19 %), construction & demolition (A.5b) with 94.6 t (15 %) and use of other products (G.4) with 176.3 t (27 %) (primarily caused by the use of fireworks).
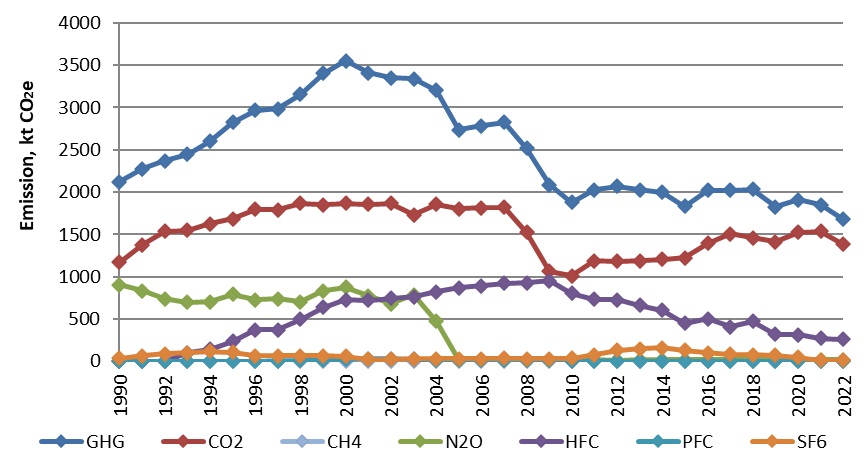
The trends of the individual greenhouse gasses along with the total GHG emission are presented in Figure 2. The decrease in emission of CO2 in 2008-2009 may be explained by the decrease in economic activity.
Figure 2 Total greenhouse gas emission and emission of the individual greenhouse gasses from the IPPU sector, and total emission and emission from individual sources for NMVOC, SO2 and PM2.5.
|
|
|
|
The main source of NMVOC emissions in the IPPU sector is solvent use. Solvents are chemical compounds which are used on a global scale in industrial processes and as constituents in final products to dissolve e.g. paint, cosmetics, adhesives, ink, rubber, plastic, pesticides and aerosols. The most abundantly used NMVOCs as solvent are ethanol, turpentine (white spirit defined as a mixture of stoddard solvent and solvent naphtha) and propylalcohol. Ethanol is used as solvent in the chemical industry and as windscreen washing agent. Turpentine is used as thinner for paints, lacquers and adhesives. Propylalcohol is used in cleaning agents in the manufacture of electrical equipment, flux agents for soldering, as solvent and thinner and as windscreen washing agent. Household emissions are dominated by propane and butane, which are used as aerosols in spray cans, primarily in cosmetics.
Emission of SO2 is mainly caused by the production of ceramics; between 0.5 kt in 2023 (77 %) and 5.0 kt in 2007 (94 %). The fluctuations in the SO2 emission during the time series are primarily caused by variations in the building/construction activities. The sale and production of tiles and bricks increased rapidly in 2003-2007, followed by a collapse of the sector in 2007-2009 due to the economic recession caused by the global financial crisis. As evident from the SO2 trend, the ceramics production never fully recovered in Denmark, but was partially moved out of the country where bricks/tiles are now often imported to Denmark from e.g. Germany.
The vast majority of nitrous oxide emissions (98 % in average) were caused by nitric acid production, the emissions therefore decreased drastically when the singular production site closed down in 2004. This shut down also caused a significant decrease in particle emissions. While PM2.5 emissions from construction and demolition have been increasing (until the years of the global financial crisis) emissions from glass production and steel production (due to the closing of the one Danish electro steelwork in 2005) have been decreasing.
Emissions from the IPPU sector are calculated based on information given in annual environmental reports/PRTR, through contact with the companies, national statistics and modelling. Also, activity data and emissions from the EU Emission Trading Scheme (EU ETS) are used. International literature or default values given in international inventory guidelines (IPCC Guidelines and EMEP/EEA Emission Inventory Guidebook) are used where no country specific data are available.
For more information on the methodology and data used in the inventory of emissions of industrial processes, see the latest sector report Danish Emission Inventory for Industrial Processes and Annexes.