Aarhus University Seal

VALIDATION TOOL FOR OSPM RESULTS

EXAMPLE OF GRAPH PRODUCED BY THE TOOL. OBSERVED AND MODELLED NO2 CONCENTRATIONS BY MONTH FOR A SPECIFIC YEAR AND STATION. THE GREEN LINE REPRESENTS MEASURED DATA AT A BACKGROUND STATION.

This page provides information on a tool designed for validation of results from the OSPM model (Operational Street Pollution Model). The tool is suitable for exploratory analysis of OSPM model performance.

The tool has the form of an Excel spreadsheet with macros, and it can produce a range of graphs and tables, which can help to verify whether the model yields the right result for the right reason.

The following material is available:

  • A small nine-page Instruction Manual by Thor-Børn Ottosen and Matthias Ketzel from November 2014.
  • A four-page conference paper from 2011 describing the use of the tool: Tool for exploratory analysis of OSPM model performance for long time series. Matthias Ketzel, Steen Solvang Jensen, Ole Hertel, Thomas Ellermann, Helge Rørdam Olesen and Ruwim Berkowicz. Prepared for the 14th International Conference on Harmonisation within Atmospheric Dispersion Modelling for Regulatory Purposes. Kos, October 2011. Download paper (pdf format, 250 kB).
  • package with the tool, including the conference paper and the Readme file (12 MB).

The following excerpt from the conference paper outlines how the tool can be used:

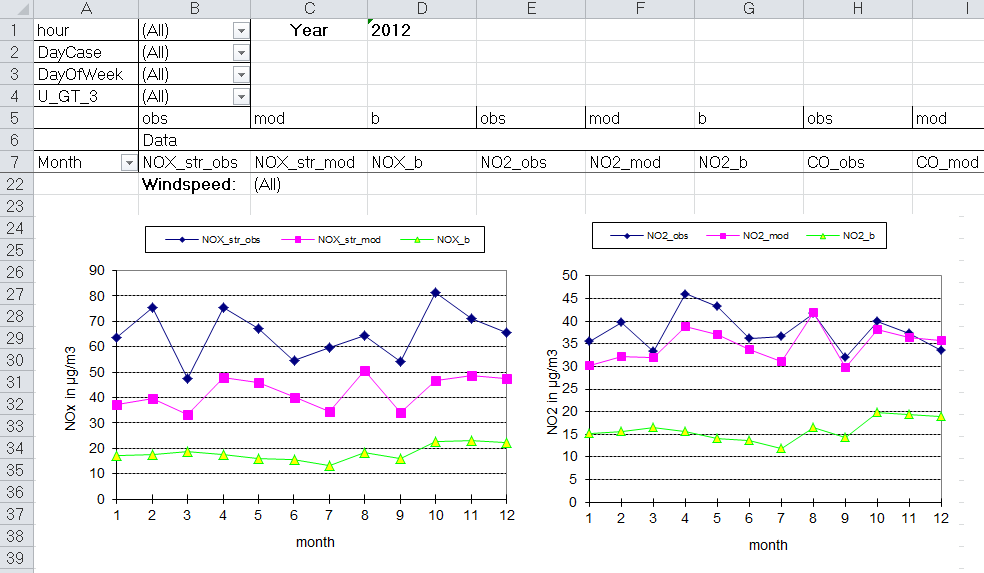
The validation tool examines trends in observed and modelled annual averages, and produces scatter plots for hourly, diurnal and monthly mean concentrations of NOx, NO2, O3, PM10, PM2.5 as well as plots displaying concentrations as function of wind direction. In the present paper examples are presented of how this tool facilitates the exploratory data analysis of observations and model results. Further is demonstrated how the tool enables the user to identify both shortcomings in the model parameterisation and possible errors and uncertainties in the measured data.

The tool in the package includes some sample data (2 years of hourly data for one street monitoring station and a background station, and 17 years of yearly summarised data for the two stations). You can use to tool with these sample data to gain an impression of how it works.

If you wish to use the tool with your own data, the requirements are as follows

  • You should have an installation of Microsoft Excel. The tool has been developed with Excel 2003. It has not been thoroughly tested with newer versions of Excel, but appears to work with Excel 2010.
  • The tool makes use of macros, so your Excel security settings must enable macros.
  • You should have access to an installation of WinOSPM (see here). WinOSPM can produce output in Excel format which can be fed directly into the tool.
  • You should have access to monitoring data which can be compared to OSPM results.
  • You should be able to create input for the OSPM model and run it.