The emission inventories for mobile sources comprises the emissions from the following transport sectors and non road machinery types:
The emission inventory basis for mobile sources is fuel consumption information from the Danish energy statistics. In addition, detailed background data for road transport (fleet and mileage), railways (train litra km, train tonnes km), air traffic (aircraft type, flight numbers, origin and destination airports), navigation (ferry technical data, no. of round trips and sailing time per ferry route), fishing vessels (vessel registration number, build year, type, overall length, brutto tonnes, total installed engine power and hours at sea) and non-road machinery (engine no., engine size, engine load factor and annual working hours) are used as input for the emission inventories. Emission factor data mainly comes from the EMEP/EEA Air Pollutant Emission Inventory Guidebook or from specific Danish research studies (e.g. Winther, 2022; Winther, 2023; Nielsen et al., 2024).
Set in relation to the Danish national emission totals, the largest emission shares for road transport are noted for NOx, CO2, CO, BC, PM2.5, PM10, NMVOC and TSP. In 2022 the emission percentages were 24, 38, 24, 17, 10, 10, 4 and 4 %, respectively. The emissions of NH3, N2O, CH4 and SO2 have marginal shares of 0.9, 2.2, 0.1 and 0.9 %, respectively.
From 1990 to 2022 the calculated fuel consumption and emission changes for CO2, CH4 and N2O are 26, 19, -91 and 44 %. The calculated 1985-2022 fuel consumption and emission changes for NOx, NMVOC, CO, particulates (exhaust only: Size is below PM2.5) and BC are 43, -78, -93, -92, -94 and -93 %.
The most significant emission changes from 1985 to 2022 occur for SO2 and NH3. For SO2 the emission drop is 99 % (due to reduced sulphur content in the diesel fuel), whereas the NH3 emissions increase by 1001 % (due to the introduction of catalyst cars).
Figure 1: Emissions from road transport, 2022. Click on the figures to enlarge.


CO2 emissions are directly fuel consumption dependent and, in this way, the development in the emission reflects the trend in fuel consumption. In 2022, the road transport fuel consumption share of the CO2 neutral bio fuels (ethanol, biodiesel, bio natural gas), has increased to 6.0 %. The most important CO2 emission source for road transport is passenger cars, followed by heavy-duty vehicles, light-duty vehicles and 2-wheelers in decreasing order.
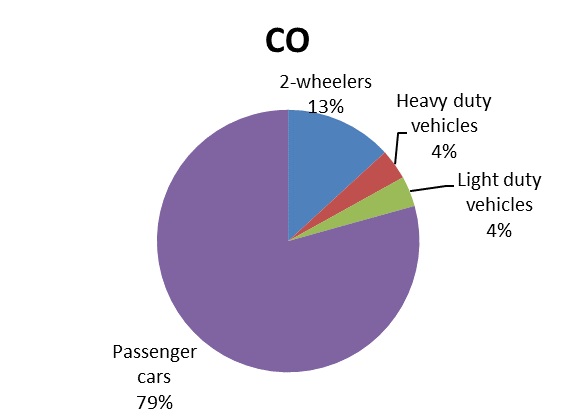
Historically, the emission totals of NMVOC and CO have been very dominated by the contributions coming from private cars. However, the NMVOC and CO (and NOx) emissions from this vehicle type have shown a steady decreasing tendency since the introduction of private catalyst cars in 1990 (EURO I) and the introduction of even more emission-efficient EURO 2, 3, 4 and 5 private cars (introduced in 1997, 2001, 2006 and 2011, respectively).
For NOx the emission decrease for passenger cars is composed of a significant drop in emissions from gasoline cars driven by technology improvements, and an increase in emissions from diesel cars due to the dieselization of the Danish vehicle fleet, and almost unchanged emission factors for diesel passenger cars until Euro 6, regardless of EU emission legislation demands. For light duty vehicles, the NOx emission trend is also the result of a technology driven emission reduction for gasoline vehicles, and a traffic induced emission increase for diesel vehicles; the emission factors for the latter vehicle category have been relatively constant until Euro 6 just as for diesel cars.
The most modern Euro 6d-TEMP and 6d diesel passenger cars and Euro 6d-TEMP and 6d light duty vehicles which entered into the fleet in 2018 and 2021, and 2019 and 2022, respectively, however, have significantly lower NOx emission factors compared to earlier Euro standards. Hence the gradual growth in the numbers of Euro 6d-TEMP and 6d vehicles is going to reduce the emissions for diesel passenger cars and light duty vehicles in the years to come. Relatively large NOx emission reductions are noted for passenger cars in 2020 related to COVID-19.
For heavy duty vehicles until Euro III, the real traffic NOx emissions are not reduced in the order as intended by the EU emission legislation. Most markedly for Euro II engines, the emission factors are even higher than for Euro I due to the so-called engine cycle-beating effect. Outside the legislative test cycle stationary measurement points, the electronic engine control for heavy duty Euro II and III engines switches to a fuel efficient engine running mode, thus leading to increasing NOx emissions (Figure 6.23). However, the reduction in transport activities due to the global financial crisis in 2008 and 2009 and improved emission factors for Euro IV onwards causes the NOx emissions for heavy duty vehicles to decrease significantly from 2008.
Exhaust particulate emissions from road transportation vehicles are well below PM2.5. The emissions from light- and heavy-duty vehicles have significantly decreased since the mid-1990s due to gradually stricter EURO emission standards. In recent years until 2008 the environmental benefit of introducing gradually cleaner diesel private cars has been somewhat outbalanced by an increase in sales of new vehicles. After 2008, the PM emissions gradually become lower due to the increasing number of Euro V cars equipped with particulate filter sold in Denmark from 2006 onwards.
BC - commonly understood as the solid part of the particulate emissions - is calculated as shares of TSP for each Euro engine technology class. In broad terms, the development in BC emissions follows the TSP emission trend, but deviates in some cases, most markedly for diesel cars and vans. For these vehicle types the BC share of TSP increases in moderate steps from conventional engine technologies to Euro IV. As a result, the BC emission development becomes environmentally less positive than for TSP, until the introduction of Euro V vehicles, for which the installed particulate filters have very high removal rates of BC.
The trend in non-exhaust particulate matter (brake and tyre wear and road abrasion) follows the traffic growth in general. In 2022 the emission share of non exhaust PM2.5 was 84 % of total road PM2.5. The non-exhaust particulate emissions are gaining more relative importance, in pace with the year by year reductions of exhaust particulate emissions.
Figure 2: Time-series for emissions from road transport, 1990-2022. Click the figures to enlarge.
Figure 2, a: CO2 emissions (k-tonnes) pr vehicle type for road transport 1990-2022. (Click here for background data) |
Figure 2, b: SO2 emissions (tonnes) pr vehicle type for road transport 1990-2022. (Click here for background data) |
Figure 2, c: NOX emissions (tonnes) pr vehicle type for road transport 1990-2022. (Click here for background data) |
Figure 2, d: CO emissions (tonnes) pr vehicle type for road transport 1990-2022. (Click here for background data) |
Figure 2, e: NMVOC emissions (tonnes) pr vehicle type for road transport 1990-2022. (Click here for background data) |
Figure 2, f: PM2.5 emissions (tonnes) pr vehicle type for road transport 1990-2022. (Click here for background data) |
Figure 2, g: BC emissions (tonnes) pr vehicle type for road transport 1990-2022. (Click here for background data) |
Apart from the exhaust emission estimates of particulate matter (PM), the Danish emission inventories also comprise the non-exhaust PM emissions coming from road transport brake and tyre wear, and road abrasion.
The respective source category distributions for TSP, PM10 and PM2.5 emissions are identical for each of the non-exhaust emission types brake wear, tyre wear and road abrasion, the PM10 distributions are shown in Figure 3. For Brake wear, passenger cars caused the highest emissions in 2022, followed by light-duty vehicles, trucks, buses and 2-wheelers. In the case of tyre wear and road abrasion, passenger cars caused the highest emissions in 2022, followed by trucks, light-duty vehicles, buses and 2-wheelers.
Figure 3 Brake and tyre wear and road abrasion PM10 emission shares and PM and BC exhaust/non-exhaust distributions for road traffic in 2022.


Figure 3 also shows the exhaust/non-exhaust distribution of the total particulate emissions from road transport, for each of the size classes TSP, PM10 and PM2.5 and for BC. The exhaust emission shares of total road transport TSP, PM10, PM2.5 and BC are 6, 9, 16 and 41 %, respectively, in 2022. For brake and tyre wear and road abrasion the TSP shares are 22, 32 and 40 %, respectively. The same three sources have PM10 shares of 33, 28 and 30 %, respectively, PM2.5 shares of 22, 34, 28 %, and BC shares of 6, 53 and 0 %, respectively. In general, the non-exhaust shares of total particulate emissions are expected to increase in the future as total exhaust emissions decline. The latter emission trend is due to the stepwise strengthening of exhaust emission standards for all vehicle types.
For other mobile sources the emissions of NOx, CO, BC and CO2 have the largest shares of the national totals in 2022. The shares are 25, 33, 17 and 10 %, respectively. The 2022 SO2, NMVOC, TSP, PM10 and PM2.5 emission shares are 7, 3, 1, 4 and 7 %, respectively.
From 1990 to 2022 the total fuel consumption and the emissions of CO2, CH4, and N2O have changed by -14, -14, -69 and 3 %, respectively. From 1985 to 2022, the calculated emission changes for SO2, NOX, NMVOC, CO, PM (all size fractions) BC are -96, -47, -65, -35, -80 and -83 %, respectively.
Figure 4: SO2, NOX, NMVOC, CO, CO2, PM and BC emission shares per source category for other mobile sources in 2022. Click the figures to enlarge.
 |  |
 |  |
 |  |
 |
For other mobile sources, the highest CO2 emissions in 2022 come from Agriculture/forestry/fisheries (1A4c), Industry-other (1A2g) and Navigation (1A3d), with shares of 37 %, 23 %, 17, respectively. The 1990-2022 emission trend is directly related to the fuel consumption development in the same time-period. Minor CO2 emission contributors are sectors such as Commercial/Institutional (1A4a), Residential (1A4b), Railways (1A3c), Civil Aviation (1A3a) and Other (1A5).
For SO2 the trends in the Navigation (1A3d) emissions mainly follow the development of the heavy fuel oil consumption and the sulphur content of the fuel. The SO2 emissions for Fisheries (1A4c) correspond with the development in the consumption of marine gas oil. The main explanation for the development of the SO2 emission curves for Railways (1A3c) and non-road machinery in Agriculture/forestry (1A4c) and Industry (1A2f), are the stepwise sulphur content reductions for diesel used by machinery in these sectors.
In general, the emissions of NOX, NMVOC, CO, PM2.5 and BC from diesel-fuelled working equipment and machinery in agriculture, forestry, industry and commercial/institutional have decreased slightly since the end of the 1990s mainly due to gradually strengthened emission standards given by the EU emission legislation directives. For industry, the emission impact from the global financial crisis becomes very visible for 2009.
The opening of the Great Belt Bridge in 1997 has caused significant reductions of the NOx and particulate emissions from navigation, due to the closing of several domestic ferry routes. For railways, the gradual shift towards electrification explains the declining trend in diesel fuel consumption and NOX emissions for this transport sector until 2001. The 1990-2022 PM2.5 emissions for navigation and fisheries are determined by the fuel use fluctuations in these years, and the development of the emission factors, which to a major extent is a function of the fuel sulphur content.
Apart from marine engines, BC is calculated as shares of TSP for each engine emission technology class and in broad terms the development in BC emissions follows the TSP emission trend. For marine engines (used in navigation and fisheries) fuel type and engine type specific BC emission factors are used in the emission calculations, and hence the BC emissions rely on the fuel consumption development per fuel type and engine type in the inventory period.
For NMVOC and CO, the significant emission increases for the commercial/institutional and residential sectors after 2000 are due to the increased number of gasoline working machines. Improved NMVOC emission factors for diesel machinery in agriculture and gasoline equipment in forestry (chain saws) are the most important explanations for the NMVOC emission decline in the Agriculture/forestry/fisheries sector. This explanation also applies for the industrial sector, which is dominated by diesel-fuelled machinery. From 1997 onwards, the NMVOC emissions from Other (1A5) decrease due to the gradually phase-out of the 2-stroke engine technology for recreational craft. The main reason for the significant 1985-2006 CO emission decrease for Agriculture/forestry-/fisheries is the phasing out of gasoline tractors.
Figure 5: Time-series for emissions from other mobile sources, 1990-2022. Click the figures to enlarge.
Figure 5, a: CO2 emissions (ktonnes) in CRF sectors for other mobile sources 1990-2022. (Click here for background data) |
Figure 5, b: SO2 emissions (tonnes) in CRF sectors for other mobile sources 1990-2022. (Click here for background data) |
Figure 5, c: NOX emissions (tonnes) in CRF sectors for other mobile sources 1990-2022. (Click here for background data) |
Figure 5, d: NMVOC emissions (tonnes) in CRF sectors for other mobile sources 1990-2022. (Click here for background data) |
Figure 5, e: CO emissions (tonnes) in CRF sectors for other mobile sources 1990-2022. (Click here for background data) |
Figure 5, f: PM2.5 emissions (tonnes) in CRF sectors for other mobile sources 1990-2022. (Click here for background data) |
Figure 5, g: BC emissions (tonnes) in CRF sectors for other mobile sources 1990-2022. (Click here for background data) |
Apart from the exhaust emission estimates of particulate matter (PM), the Danish emission inventories also comprise the non-exhaust PM emissions coming from train contact wire wear, wheel and rail wear and brake wear for railways, and tyre and brake wear for aircraft landings in civil aviation.
Figure 6 Non-exhaust PM10 emission shares for domestic civil aviation and railways, and PM exhaust/non-exhaust distributions for civil aviation and railways in 2022.

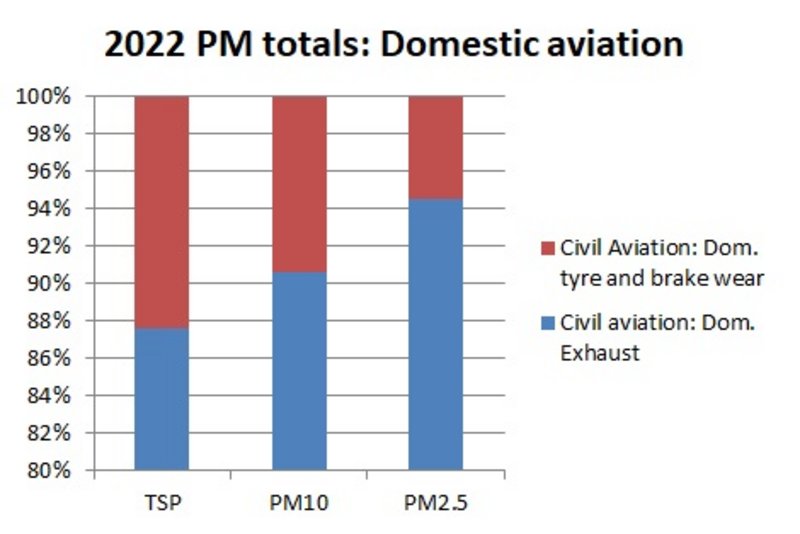
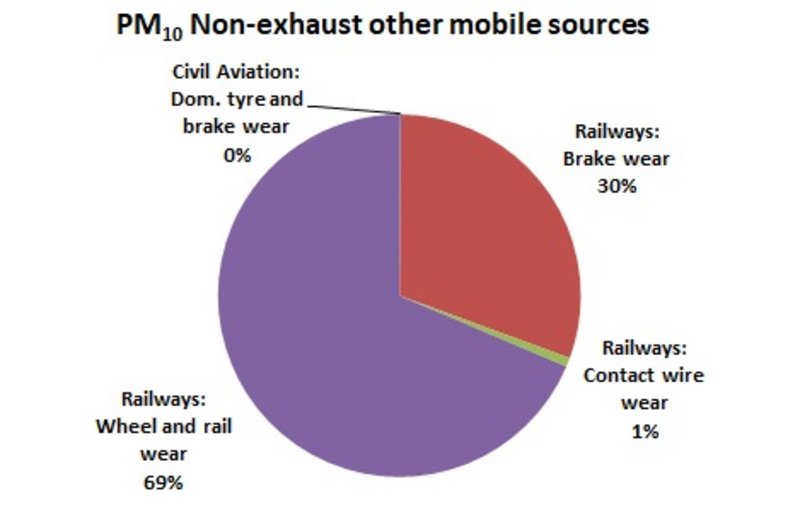
For PM10, the non-exhaust emissions coming from train wheel and rail wear, brake wear and contact wire wear make up 69 %, 30 % and 1 % of the total non-exhaust emissions for other mobile sources. For railways, the exhaust emissions of TSP, PM10, PM2.5 make up 2 %, 2 % and 4 %, respectively, of the total TSP, PM10, PM2.5 emissions from railways. For civil aviation, the exhaust emissions of TSP, PM10, PM2.5 make up 42 %, 49 % and 64 %, respectively, of the total TSP, PM10, PM2.5 emissions from civil aviation.
Emission factors for mobile sources are available on the emission inventory home-page.
For a more detailed description of the data and methodology for the inventory of mobile sources see the report Danish emission inventories for road transport and other mobile sources and the annexes for the report.
For more details on non-road machinery specifically, see the report Energy consumption and emissions from non-road machinery in Denmark and the annexes for the report.


