In the Danish emission inventories system, emissions from waste are divided into five main groups of sources:
Solid waste disposal sites (SWDS) have historically been the dominant source of greenhouse gases in the waste sector, but since 2016 the dominant source has been Biological treatment of solid waste; i.e. composting and anaerobic digestion at biogas facilities. The following figure presents the time series for greenhouse gas emissions from the waste sector divided in the five sub-sectors.
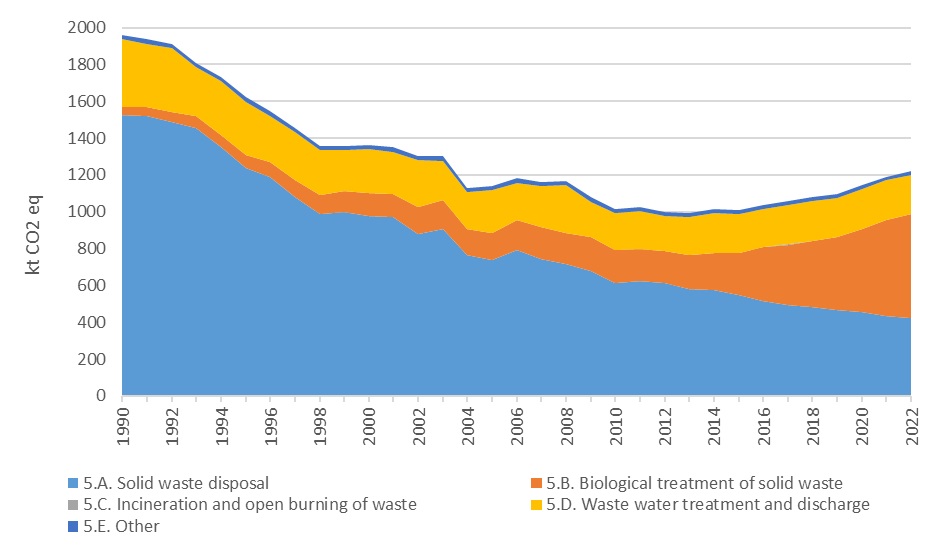
Greenhouse gas emissions from solid waste disposal on land have decreased from 45.4 kt CH4 (1272 kt CO2 eq) in 1990 to 7.6 kt CH4 (212 kt CO2 eq) in 2024, corresponding to a decrease of 83 %. While emissions from biological treatment of solid waste have increased from 1.1 kt CH4 and 0.05 kt N2O (43 kt CO2 eq) in 1990 to 18.9 kt CH4 and 0.2 kt N2O (567 kt CO2 eq) in 2024, corresponding to an increase of 1205 %. This increase is largely caused by increased biogas production.
In addition to greenhouse gasses, the emissions inventories for the waste sector includes emissions of SO2, NOx, NMVOC, CO, NH3, particles (TSP, PM10 and PM2.5, BC), heavy metals (As, Cd, Cr, Cu, Hg, Ni, Pb, Se, Zn) and POPs (PCDD/F, benzo(b)flouranthene, benzo(k)flouranthene, benzo(a)pyrene, indeno(1,2,3-cd)pyrene, HCB and PCBs). This section focuses on SO2, NMVOC, PM2.5, Pb, Hg and PCDD/F. For more information on the other pollutants, please refer to the UNECE report (IIR report).
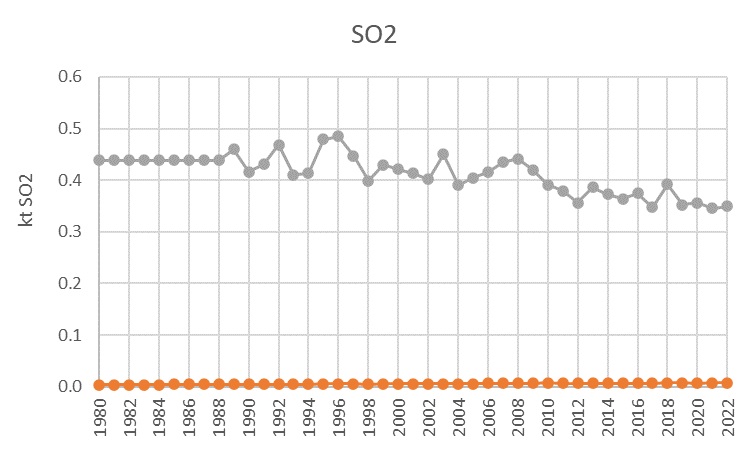
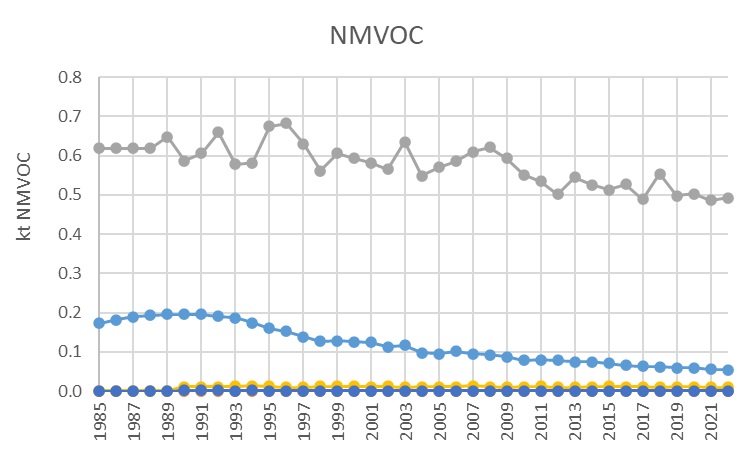

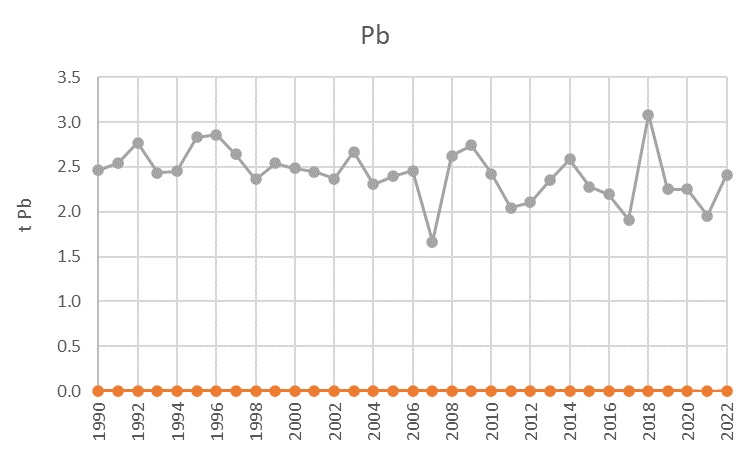
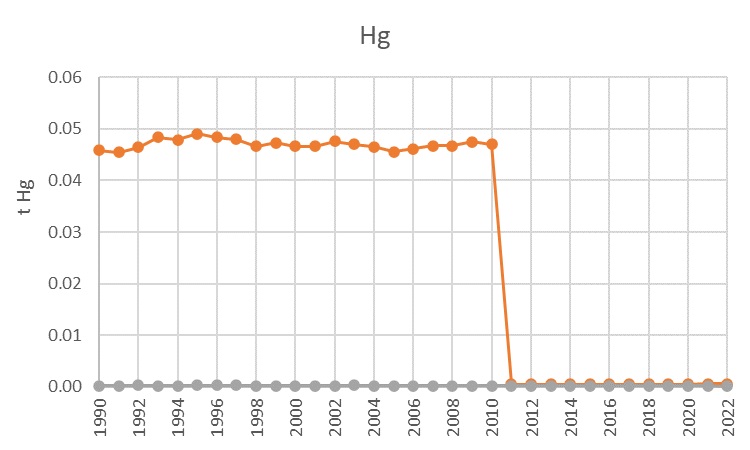
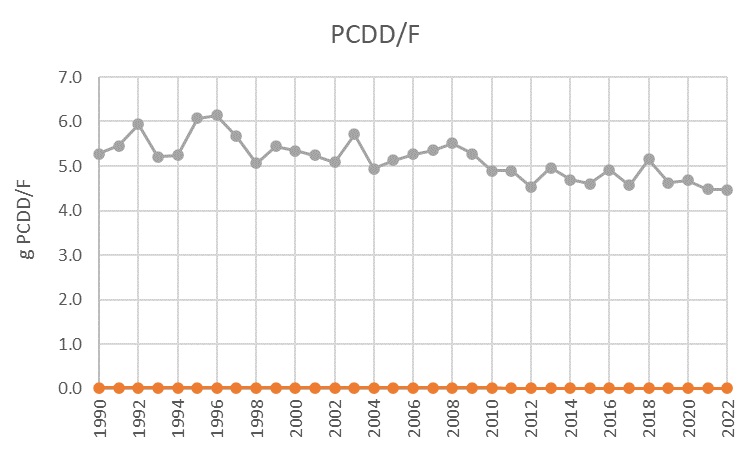
Figure 2a-f Time series for SO2, NMVOC, PM2.5, Pb, Hg and PCDD/F for the waste sector.
Other waste (i.e. accidental fires) is the dominant source for several pollutants. While many other sources from all sectors show a decreasing emission trend, this is not the case for accidental fires where emissions are rather constant throughout the time series. Because of this, accidental fires are becoming increasingly relevant on a national emission level. While an emission of 0.44 kt SO2 from the waste sector in 1980 only amounted to 0.1 % of the national SO2emission, a similar emission (0.33 kt) in 2024 corresponds to 4.6 % of national emissions of SO2. The same picture is seen for emissions of Pb (from 2 % in 1990 to 13 % in 2024) and PCDD/F (from 8 % in 1990 to 17 % in 2024).
The strong decrease in Hg emissions from cremations from 2011 is due to the installation of flue gas cleaning equipment at all Danish crematoria.
NH3 emissions from the waste sector stem from composting, biogas facilities and cremation. The vast majority of NH3 emissions in Denmark originate from the agricultural sector and emissions from the waste sector do not exceed 1 % of the national total in the time series since 1985.
Solid waste disposal sites constitutes a sub-sector in the waste sector. In the Danish emission inventory system CH4 emissions from the degradation of organic waste at solid waste disposal sites are calculated with use of a first order decay (FOD) model as recommended by the IPCC in their guidelines.
Figure 3 presents a time series of the annual deposited methane potential and the resulting annual net methane emission. The net emission is excluding methane collected for energy production and methane oxidised in the topsoil layer (deposited waste is covered with soil to reduce emissions).
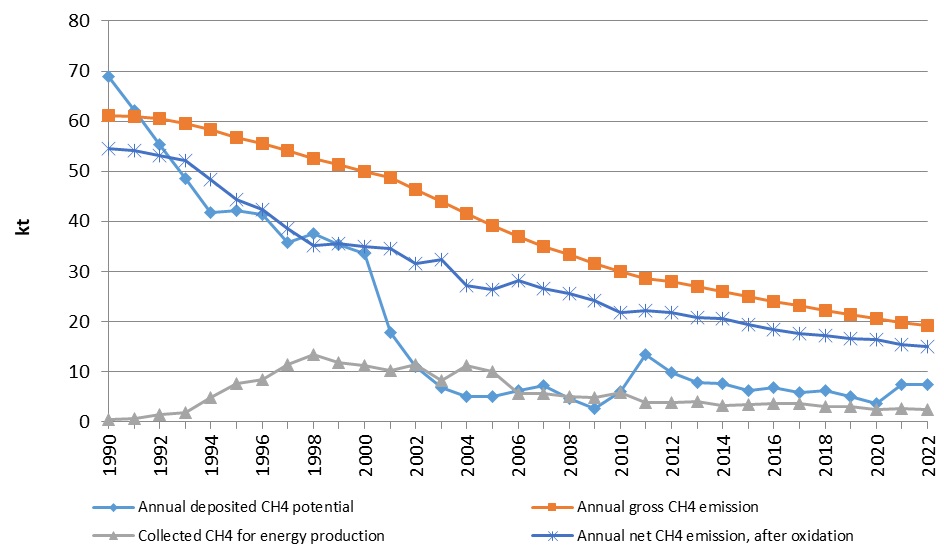
The general development for solid waste at disposal sites is a result of action plans by the Danish government. Since the "Action plan for Waste and Recycling 1993-1997", a series of action plans have been developed, resulting in continuous development in the reduction of depositing of degradable waste. The decrease in the methane emission throughout the time-series is much less than the general decrease in the amount of waste deposited. This is due to the time involved in the processes generating the CH4, which is reflected in the first order decay model used for calculating the annual methane emission from solid waste disposal sites in Denmark. Figure 4 and Figure 5 presents activity data for deposited waste amounts since 1990 – The FOD model uses activity data back to the year 1940.

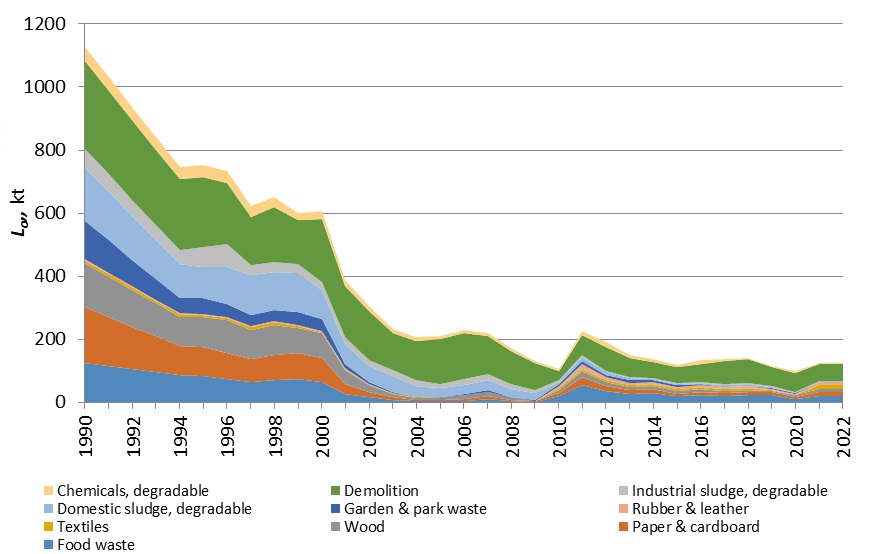
(Click here for backgrounddata for Figures 4 and 5)
As may be observed from the figures showing the time trend in inert and degradable waste types, the amounts of deposited inert waste types are significantly higher than the deposited amounts of biodegradable waste types. The decrease in the amount of deposited degradable waste is reflected in the resulting time-series visualised in Figure 3.
Emissions of NMVOC are estimated using the Tier 2 methodology (based on the modelled CH4 emission), while particulate matter (PM) emissions from waste handling at solid waste disposal sites are calculated according to the Tier 3 emission modelling and use of facility data as described in the EMEP/EEA air pollutant emissions inventory guidebook 2023. The Tier 3 calculations from which the PM emissions factors are derived, include parameters such as moisture content and national mean wind speed.
For the purpose of calculating PM emissions from operations associated with depositing waste at landfills, the annual amount of deposited waste (inert and organic) was applied, while the calculation of the emissions of NMVOC, is done with the net CH4 emission as activity data. The activity data for these calculations are presented in Figure 3-5 and in their background data. Emissions are presented in Figure 2a-f.
Biological treatment of solid waste in Denmark, includes composting and anaerobic digestion at biogas facilities. Composting of solid biological waste includes composting of garden waste, organic waste from households and other sources, sludge composting and home composting of garden and vegetable food waste. Composting leads to emissions of CH4, N2O CO and NH3, while emissions from biogas facilities include CH4 and NH3. Emissions from composting have been calculated using both IPCC default emission factors and country-specific emission factors, corresponding to a hybrid Tier 1/Tier 2 methodology. Emissions of CH4 from biogas plants occur from stacks and ventilation during several stages of the process, e.g. ventilation in the receiving hall of the plant, from the emergency flare and from upgrading units. Emissions that are more significant occur from leakages in the production equipment and pipelines. These leakages are by nature very variable from plant to plant and as such difficult to quantify at a national level. Emissions from leakage are calculated using a country specific emission factor.
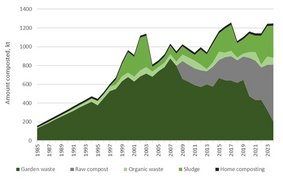
Figure 6 and Figure 7 presents the activity data the two sources respectively.
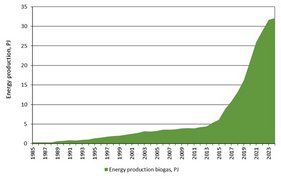
Greenhouse gas emissions are presented in Figure 1. NH3 and CO emissions are miniscule on a national level.
Composting contributes with CH4 and N2O emissions, where CH4 contributes the most (60-65 % of CO2 equivalent compost emissions). Emissions from anaerobic digestion have increased from 0.2 kt CH4 (6.2 kt CO2e) in 1990 to 16.1 kt CH4 (450.4 kt CO2e) in 2024, while emissions from composting have increased from 37 kt CO2e in 1990 to 116 kt CO2e in 2024. Due to the steep increase in energy production at biogas facilities, emissions from anaerobical digestion have increased from representing 14 % of CO2 equivalents from the Biological treatment of solid waste sub-sector in 1990 to 79 % in 2024.
Biological treatment of solid waste constitutes between 2 % (1990) to 55 % (2024) of the total CO2 equivalent emission from the Waste sector.
Incineration of municipal, industrial, clinical and hazardous waste takes place with energy recovery and therefore the emissions are included in the relevant subsectors under the Energy sector. There is no open burning considered in the Danish inventories. The subsector of Incineration and Open Burning is comprised by emission from human and animal cremations. CO2 emissions from animal and human cremations are biogenic, leaving CH4 and N2O emissions as the only relevant greenhouse gasses. As seen from Figure 1, emission of greenhouse gasses from this source is miniscule. However, the emissions of especially Hg caused by cremations contributes to a considerable part of the total national emissions. In addition to the most frequently discussed emissions of Hg and PCDD/Fs, are the emissions of compounds like SO2, NOx, NMVOC, CO, other heavy metals (As, Cd, Cr, Cu, Ni, Pb, Se, Zn), particulate matter, HCB, PAHs and PCBs. Emissions of the most relevant pollutants are presented in Figure 2.
The Danish wastewater treatment system is characterised by few big and advanced wastewater treatment plants (WWTPs) and many smaller WWTPs. For the part of the population, which is not connected to the collective sewer system (i.e. scattered houses), septic sludge is collected and transported for treatment at the centralised WWTPs. Municipal collection of sludge from septic tanks occurs at a frequency set by the local authorities and in general, septic tanks are emptied one time each year.
The wastewater source category includes an estimation of the emission of CH4, N2O and NMVOC from wastewater handling, i.e. wastewater collection, treatment and discharge. CH4 is produced during anaerobic conditions and treatment processes, while N2O and NMVOC may be emitted as a by-product from nitrification and denitrification processes under anaerobic as well as aerobic conditions.
The methodology for estimating emission of methane and nitrous oxide from wastewater handling follows the IPCC Guidelines and the NMVOC calculations follow the default Tier 2 methodology of EMEP/EEA Guidebook.
Figure 8 presents greenhouse gas emissions from wastewater in detail.
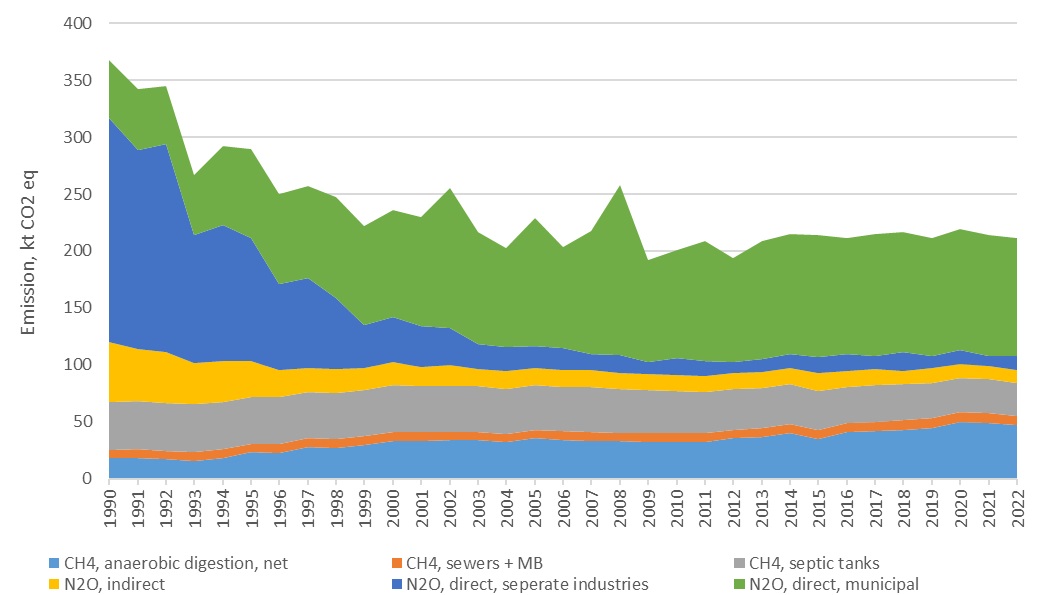
Fugitive methane emissions from the municipal and private WWTPs originate from 1) the sewer system, primary settling tank and biological N and P removal processes, 2) from anaerobic treatment processes in closed systems with biogas recovery for energy production, 3) septic tanks, 4) domestic wastewater discharge and 5) industrial wastewater discharge.
Regarding the time trend, the net CH4 emission from anaerobic treatment has increased 152 % from 1990 to 2024, while a less significant increase is observed in the CH4 emission from the sewer system (incl. mechanical and biological treatment) (10 %).The CH4 emission from scattered houses not connected to the collective sewer system has decreased with 30 % reflecting the increase in the number of people connected to the collective sewer system and lastly, CH4 emissions from effluent has decreased by 89 %. In total, CH4 emissions have decreased by 59 % from 1990 (8.6 kt) to 2024 (3.5 kt).
N2O formation and releases, are included from the treatment processes at the WWTPs (both municipal and at separate industries) and from discharged effluent wastewater.
The emission of N2O from wastewater handling is calculated as the sum of contributions from wastewater treatment processes at the WWTPs (direct emissions) and from sewage effluents (indirect emissions). The emission from effluent wastewater, i.e. indirect emissions, includes separate industrial discharges, rainwater-conditioned effluents as well as effluents from scattered houses and from aquaculture.
Regarding the time trend, the total indirect N2O emission has decreased 67 % from 1990 to 2024, the direct N2O emission from separate industries has decreased by 86 %, while the direct N2O emission from municipal wastewater treatment plants only decreased by 8 %. The latter only decreased slightly, because the fraction of industrial wastewater being treated at municipal WWTPs has increased. In total, the N2O emission has decreased 37 % from 1990 (0.8 kt) to 2024 (0.5 kt).
The annual fluctuations are caused by several factors, e.g. climatic condition such as variations in precipitation and as a result varying contributions to the influent N and varying characteristics of especially the industrial contributions to the influent. Furthermore, infiltration of groundwater, as well as exfiltration of overload rainwater and wastewater contribute to the “noise” or fluctuation in the trend of the calculated N2O emission. The decrease in indirect emissions is caused by improved cleaning efficiencies by the treatment plants.
The sub-sector Other is comprised by the subcategory accidental fires grouped into four types of accidental fires: Vehicle fires, Container fires, Residential building fires and Non-residential building fires. Greenhouse gasses that are estimated from these processes are CH4 and CO2. No emission factors are available for N2O. Air pollutants that are emitted from fires include SO2, NOx, NMVOC, CO, particulate matter, heavy metals (As, Cd, Cr, Cu, Ni, Hg, Pb, Se, Zn), HCB, PCDD/F, PCB and PAHs.
Emissions from accidental fires are calculated from the raw activity data given by the Danish Emergency Management Agency. These raw data are detailed registrations of every fire where the authority was summoned. A database model is produced, to translate these detailed data into mass or area burned. The model calculates emissions from 18 different object types individually, e.g. detached buildings, apartment buildings, combined harvesters, ships, passenger cars/light duty vehicles etc.
The numbers of fires are then calculated into full scale equivalent fires (FSE). The types and number of jet tubes used for the fire extinguishing is used to evaluate if the fire should be considered small (5 % of mass or area combusted), medium (30 %), large (75 %) or full (100 %).
For each of the 12 vehicle types and containers, the numbers of FSE fires are then multiplied with an average mass, e.g. 12 kg per bicycle, 5 tonnes per tractor, 1.5 tonnes per caravan, 1 tonne per container etc. Container fires covers all types of containers, from small residential garbage containers to large shipping containers. It is assumed that all the different vehicle types lead to similar emissions. For each of the five building types, the numbers of FSE fires are multiplied with the average area, e.g. 130 m2 per undetached building, 500 m2 per industrial building, 20 m2 per additional building etc. Different emission factors are available for vehicle fires, container fires, residential building fires and non-residential fires. The calculated mass of combusted vehicle is therefore summed, and the same for residential building area and non-residential building area, reducing the number of fire types from 18 to four.
Greenhouse gas emissions from this source are small, see Figure 1, but emissions of SO2, PM2.5, Pb and PCDD/F from accidental fires are significant compared to the national emissions. For 2024, SO2, PM2.5, Pb and PCDD/F emissions from accidental fires comprise 5 %, 3 %, 13 % and 17 % of the national emissions respectively. The trends for these emissions are presented in Figure 2.
Detailed inventories are available for 5A. Solid waste disposal on land and 5D. Wastewater treatment and discharge. Click on the front page images below to open the reports, and use the following links to download the annexes.