DCE is responsible for preparing the official Danish projections of air pollution on request from the Danish Environmental Protection Agency. The first projection was made for the Danish Environmental Protection Agency in the project ‘Projection models 2010’. In this project a range of sector-related partial models were developed to enable projection of the emissions of SO2, NOx, NMVOC and NH3 2010 to 2030 (Illerup et al., 2002). Further updates have occurred in the projects:
This page presents a description of the models and background data used for the emission projection of the pollutants sulphur dioxide (SO2), nitrogen oxides (NOX), non-methane volatile organic compounds (NMVOC), ammonia (NH3) particulate matter with diameter less than 2.5 µm (PM2.5) and black carbon (BC) for Denmark. The emissions are projected to 2040 using basic scenarios which include the estimated effects on emissions of policies and measures implemented until January 2022 (‘with measures’ projections, WM).
Official Danish projections, e.g. the official energy projection from the Danish Energy Agency, are used to provide activity rates in the models for those sectors for which these projections are available. The emission factors refer to international guidelines or are country-specific, referring to Danish legislation, Danish research reports or calculations based on emission data from a considerable number of plants in Denmark. The projection models are based on the same structure and methodology as the Danish emission inventories in order to ensure consistency.
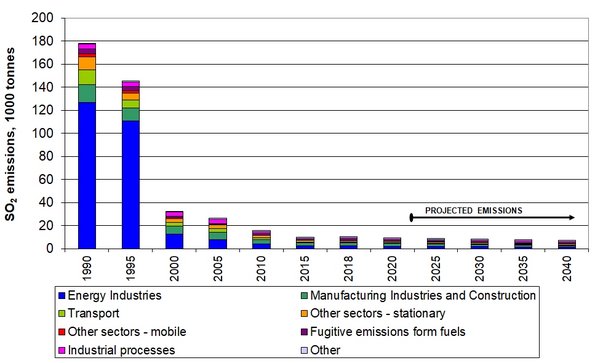
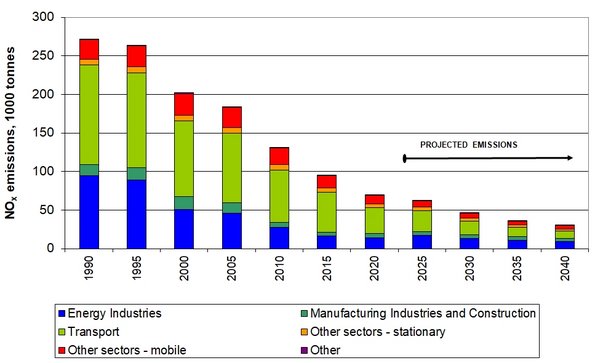
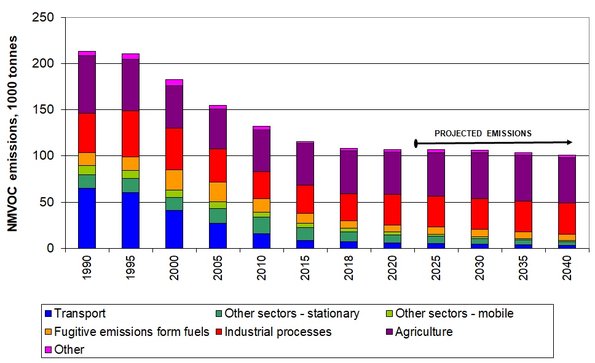
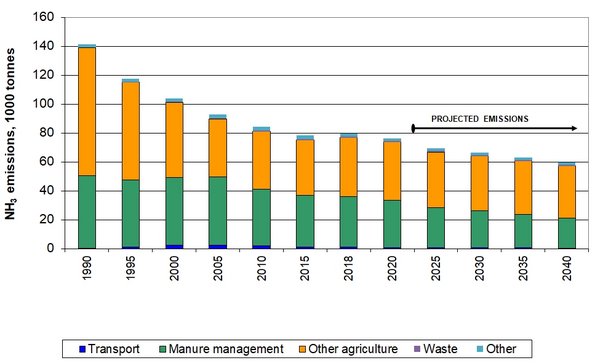
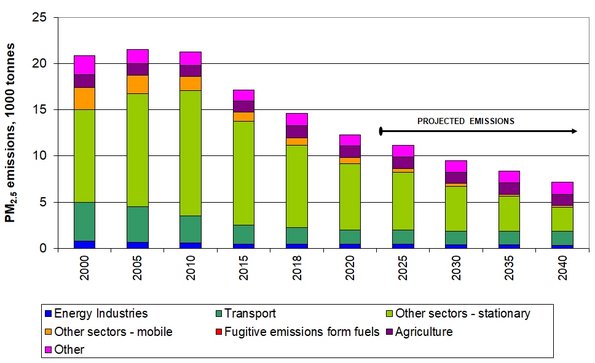
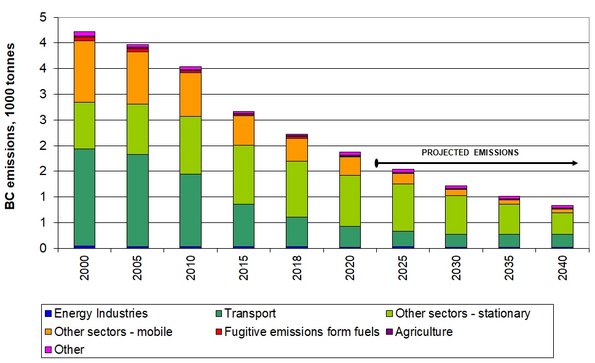
The historical emissions in the historical years 2005 and 2020, are shown in Table 1 together with the projected emissions for 2025, 2030, 2035 and 2040. Figure 1 a-e show emission time series. Further information on the projection can be found in the Annual Danish Informative Inventory Report 2023 including information on adjustments.
Table 1 Historical emissions [tonnes] for 2005 and 2020 and projected emissions for 2025, 2030, 2035 and 2040.
| Pollutant | 2005 | 2020 | 2025 | 2030 | 2035 | 2040 |
| SO2 | 26 293 | 9 145 | 8 917 | 8 094 | 7 467 | 7 019 |
| NOx | 201 517 | 89 025 | 79 427 | 63 186 | 52 864 | 47 041 |
| NOx* | 183 768 | 69 403 | 61 980 | 46 045 | 35 851 | 30 155 |
| NMVOC | 154 607 | 106 584 | 106 694 | 106 031 | 103 585 | 100 719 |
| NMVOC* | 111 538 | 60 393 | 59 295 | 56 270 | 54 015 | 51 475 |
| NMVOC** | 134 554 | 82 633 | 81 398 | 78 839 | 76 389 | 73 649 |
| NH3 | 92 554 | 76 254 | 69 337 | 66 300 | 62 813 | 59 498 |
| PM2.5 | 21 522 | 12 310 | 11 173 | 9 523 | 8 368 | 7 153 |
| BC | 3 969 | 1 876 | 1 540 | 1 217 | 1 020 | 840 |
| * Excluding manure management and agricultural soils. | ||||||
| ** Including adjustment for dairy cattle. | ||||||
Click here to get detailed data from the air pollution projection with measures (May 2022)
Figure 1 Historical and projected emissions for the time series 1990-2040 for a) SO2, b) NOx, c) NMVOC, and d) NH3, and 2000-2040 for e) PM2.5, and f) BC