The greenhouse gases reported under the Climate Convention are:
The main greenhouse gas responsible for the anthropogenic influence on the heat balance is CO2. The atmospheric concentration of CO2 has increased from a pre-industrial value of about 280 ppm to about 390 ppm in 2010 (an increase of about 38 %)(IPCC, Fifth Assessment Report, 2013), and exceeds the natural range of 180-300 ppm over the last 650 000 years as determined by ice cores. The main cause for the increase in CO2 is the use of fossil fuels, but changing land use, including forest clearance, has also been a significant factor. The greenhouse gases CH4 and N2O are very much linked to agricultural production; CH4 has increased from a pre-industrial atmospheric concentration of about 722 ppb to 1803 ppb in 2011 (an increase of about 150 %) and N2O has increased from a pre-industrial atmospheric concentration of about 270 ppb to 324 ppb in 2011 (an increase of about 20 %) (IPCC, Fifth Assessment Report, 2013). Changes in the concentrations of greenhouse gases are not related in simple terms to the effect on the heat balance, however. The various gases absorb radiation at different wavelengths and with different efficiency. This must be considered in assessing the effects of changes in the concentrations of various gases. Furthermore, the lifetime of the gases in the atmosphere needs to be taken into account – the longer they remain in the atmosphere, the greater the overall effect. The global warming potential (GWP) for various gases has been defined as the warming effect over a given time of a given weight of a specific substance relative to the same weight of CO2. The purpose of this measure is to be able to compare and integrate the effects of individual substances on the global climate. Typical lifetimes in the atmosphere of substances are very different, e.g. 9 and 130 years approximately for CH4 and N2O, respectively. Therefore, the time perspective clearly plays a decisive role. The time frame chosen is typically 100 years. The effect of the various greenhouse gases can, then, be converted into the equivalent quantity of CO2, i.e. the quantity of CO2 giving the same effect in absorbing solar radiation. According to the IPCC and their Fourth Assessment Report (IPCC, 2007), which UNFCCC (UNFCCC, 2013) has decided to use as reference for reporting for inventory years throughout the commitment period 2013-2020, the global warming potentials for a 100-year time horizon are:
Based on weight and a 100-year period, methane is thus 25 times more powerful a greenhouse gas than CO2, and N2O is 298 times more powerful. Some of the other greenhouse gases (hydrofluorocarbons, perfluorocarbons and sulphur hexafluoride) have considerably higher global warming potential values. For example, sulphur hexafluoride has a global warming potential of 22 800.
The indirect greenhouse gases reported are nitrogen oxides (NOx), carbon monoxide (CO), non-methane volatile organic compounds (NMVOC) and sulphur dioxide (SO2).
At the United Nations Conference on Environment and Development in Rio de Janeiro in June 1992, more than 150 countries signed the UNFCCC (the Climate Convention). On the 21st of December 1993, the Climate Convention was ratified by a sufficient number of countries, including Denmark, for it to enter into force on the 21st of March 1994. One of the provisions of the treaty was to stabilise the greenhouse gas emissions from the industrialised nations by the end of 2000. At the first conference under the UN Climate Convention in March 1995, it was decided that the stabilisation goal was inadequate. At the third conference in December 1997 in Kyoto in Japan, a legally binding agreement was reached committing the industrialised countries to reduce the six greenhouse gases by 5.2 % by 2008-2012 compared with the base year. For CO2, CH4 and N2O the base year is 1990. For F-gases, the countries can choose freely between 1990 and 1995 as the base year. On May 16, 2002, the Danish parliament voted for the Danish ratification of the Kyoto Protocol. Denmark (including Greenland and excluding the Faroe Islands) is, thus, under a legal commitment to meet the requirements of the Kyoto Protocol, when it came into force on the 16th of February 2005. Hence, Denmark (including Greenland) is committed to reduce greenhouse gases with 8 %.
The European Union is under the KP committed to reduce emissions of greenhouse gases by 8 %. However, within the EU, member states have made a political agreement – the Burden Sharing Agreement – on the contributions to be made by each member state to the overall EU reduction level of 8 %. Under the Burden Sharing Agreement, Denmark (excluding Greenland and the Faroe Islands) had to reduce emissions by an average of 21 % in the period 2008-2012 compared with the base year emission level.
For the second commitment period, the EU has a target of 20 % reduction compared to the base year. The reduction commitment within the EU distinguishes between the emissions covered by the EU Emission Trading System (ETS) and the non-ETS emissions. For the ETS there is a reduction of 24 % in allowances. For the non-ETS emissions, each Member State has a separate target set out in the Effort Sharing Decision, (ESD, Decision No 406/2009/EC). In the ESD, Denmark has a reduction commitment of 20 % in 2020 compared to the emission level in 2005.
In accordance with the Kyoto Protocol, Denmark’s base year emissions include the emissions of CO2, CH4 and N2O in 1990 in CO2 equivalents and Denmark has chosen 1995 as the base year for the emissions of HFCs, PFCs and SF6 and NF3.
The European Union (EU) is a party to the UNFCCC and the Kyoto Protocol. Therefore, the EU has to submit similar datasets and reports for the collective 28 EU Member States. For the commitment in the second commitment period, the EU has entered into an agreement with Iceland on joint fulfilment.
The EU imposes some additional guidelines and obligations to these EU Member States through Regulation No. 525/2013/EU concerning a mechanism for monitoring and reporting greenhouse gas emissions and for implementing the Kyoto Protocol (EU monitoring mechanism). The Implementing Regulation detailing the reporting requirements was decided in 2014 (749/2014/EU). As mentioned above, the ESD is the legal framework for Member States reduction commitments in the non-ETS sectors.
The greenhouse gas emissions are estimated according to the IPCC guidelines and are aggregated into six main sectors. The greenhouse gases include CO2, CH4, N2O, HFCs, PFCs and SF6. The figures below show the allocation of CO2 equivalent emissions in 2017 in the different sectors and the estimated total greenhouse gas emissions in CO2 equivalents from 1990 to 2017. The emissions are not corrected for electricity trade or temperature variations.
CO2 is the most important greenhouse gas contributing in 2017 to the national total in CO2 equivalents excluding LULUCF (Land Use and Land Use Change and Forestry) with 73.1 %, followed by CH4 with 14.4 %, N2O with 11.5 %, and f-gases (HFCs, PFCs, SF6 and NF3) with 1.0 %. The energy sector and agriculture represent the largest sources, followed by industrial processes and product use and waste, see Figure 2.1. The net GHG emission by LULUCF in 2017 is 5.9 % of the total emission in CO2 equivalents excl. LULUCF. The total national greenhouse gas emission in CO2 equivalents excluding LULUCF and including indirect CO2 has decreased by 31.9 % from 1990 to 2017, if excluding indirect CO2 the emissions have decreased by 31.2 %. The decrease is mainly caused by decreasing emissions from the energy sector due to increasing production of wind power and other renewable energy. Comments on the overall trends etc. seen in Figure 2.1 are given in the sections below on the individual greenhouse gases.
CO2-equivalent emission, 2017
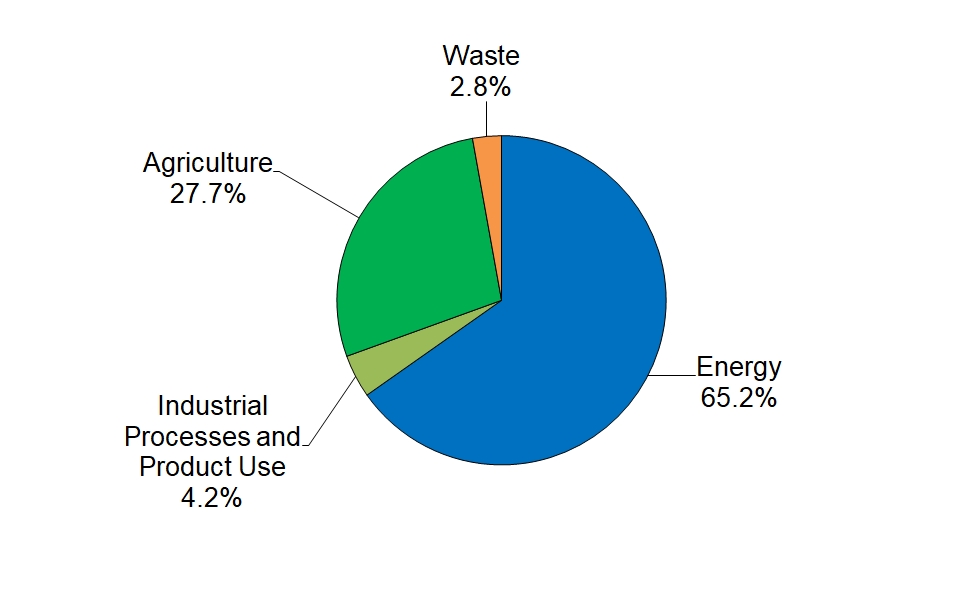
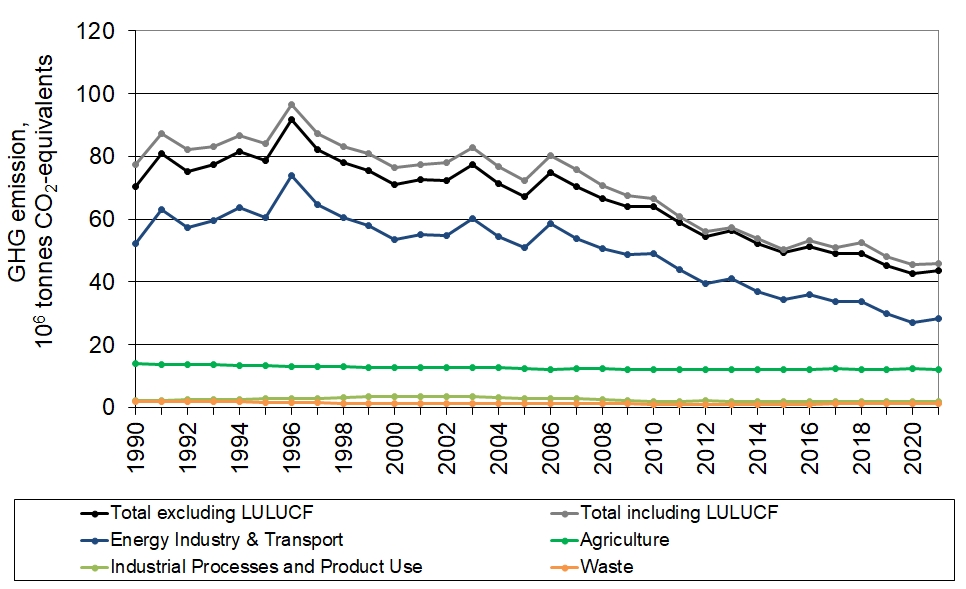
Illustrations: Greenhouse gas emissions in CO2-equivalents distributed on main sectors and for the time-series. For background data, click here.
Links to detailed background data for greenhouse gas emissions can be found under "Supporting documentation".
Read more about the greenhouse gasses:
