Department of Environmental Science and DCE - The National Center for Environment and Energy has developed a model for spatial distribution of emissions – the SPREAD model. The model is a high-resolution model designed to provide high-quality input to air quality modelling.
In 2011, the first version of a spatial high-resolution distribution model for emissions to air (SPREAD) was published. Improvements and updates are made continuously. A large restructuring of the model was finalised in 2018 and an updated documentation report was published (Plejdrup et al., 2018).
The latest version of the model, SPREAD 3.0, was prepared in 2021 and a updated documentation report was published (Plejdrup et al., 2021). In this version, a number of geographic distribution keys (GeoKeys) was improved through incorporation of new spatial data and/or implementation of new methodologies for spatial distribution of emissions.
The SPREAD model use a high spatial resolution (1 km x 1 km), to increase the usefulness of the emission data in air quality modelling. This high-resolution distribution has been used in research projects focusing, on either national total emission covering all emission sectors, or in case studies for one or a few sectors, e.g. residential wood combustion. The current EMEP grid is a 0.1 degree x 0.1 degree resolution, which for Denmark implies grid cells with a dimension of approximately 6 km x 11 km.
The development of the SPREAD model has largely been driven by the participation in research projects. Resources from the framework contract between AU and the Ministry of Environment and Food has been used to implement the new EMEP grid, when this was changed from 50 km x 50 km to 0.1° x 0.1°. SPREAD includes emission distributions for each sector emitting air pollution in the Danish inventory system. The main sectors are stationary combustion, mobile combustion, fugitive emissions from fuels, industrial processes and product use, agriculture and waste. However, the spatial distribution is carried out at the most detailed level possible. Currently, greenhouse gases are not included in the model.
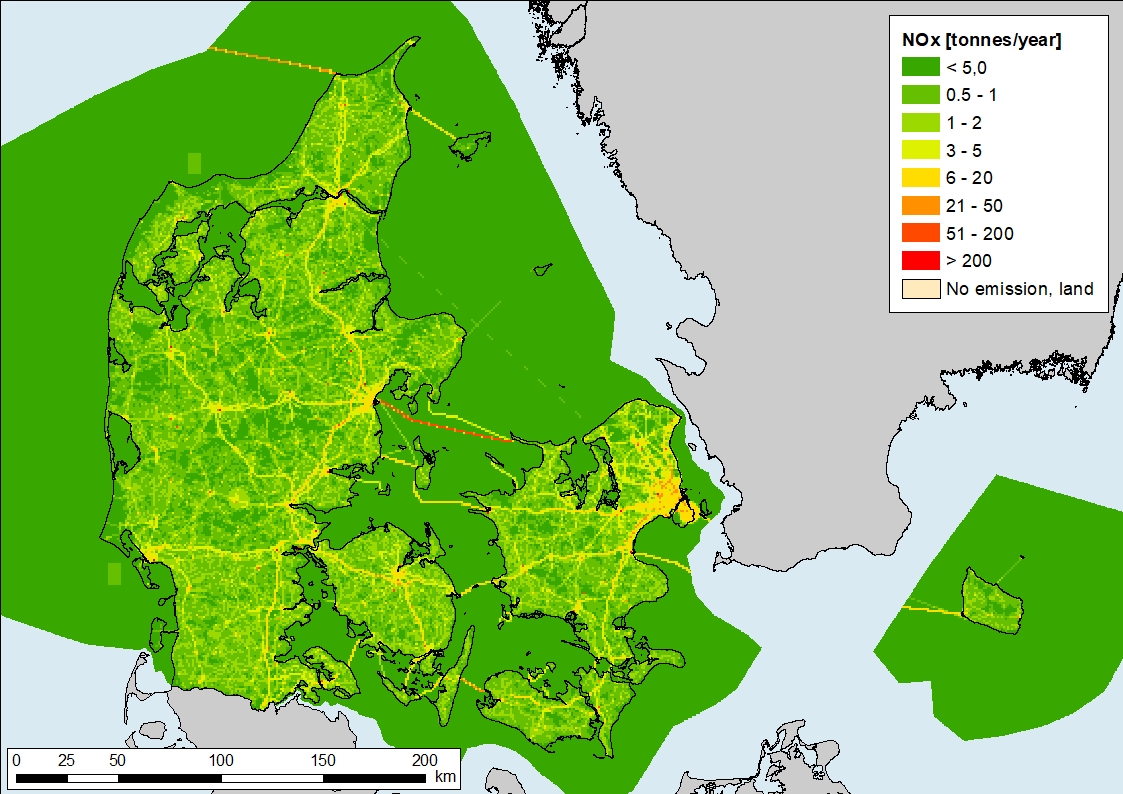
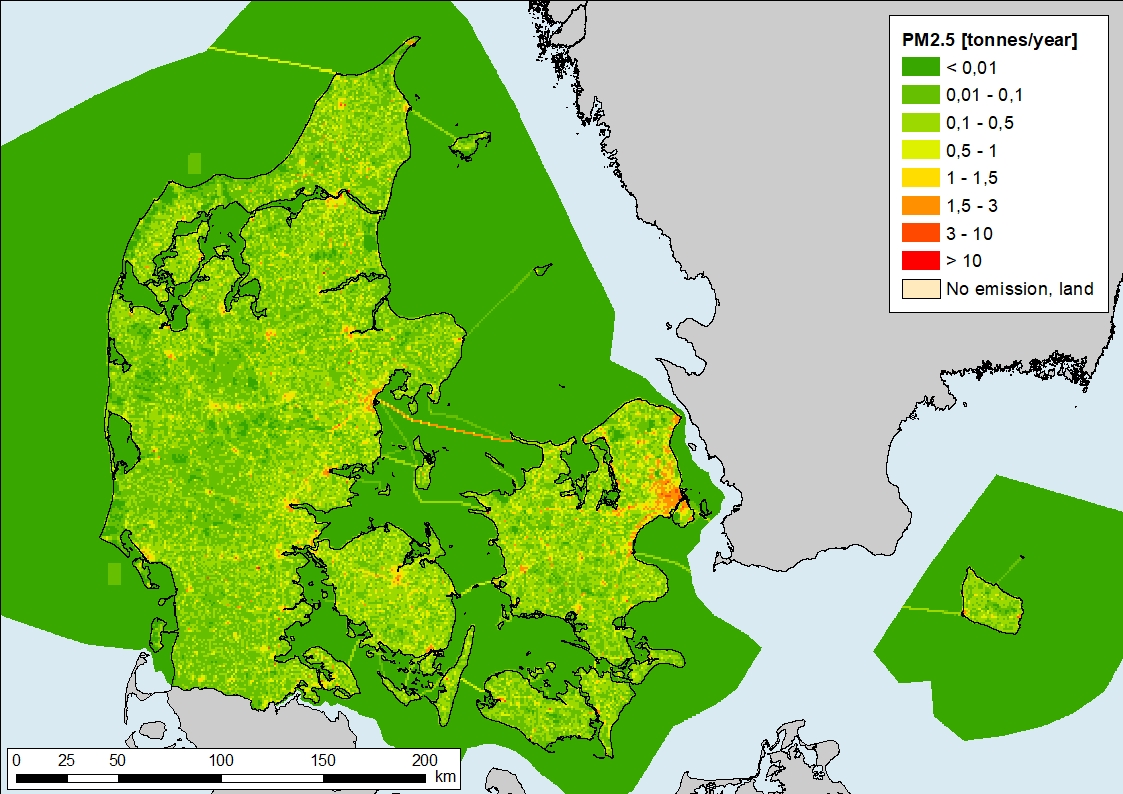
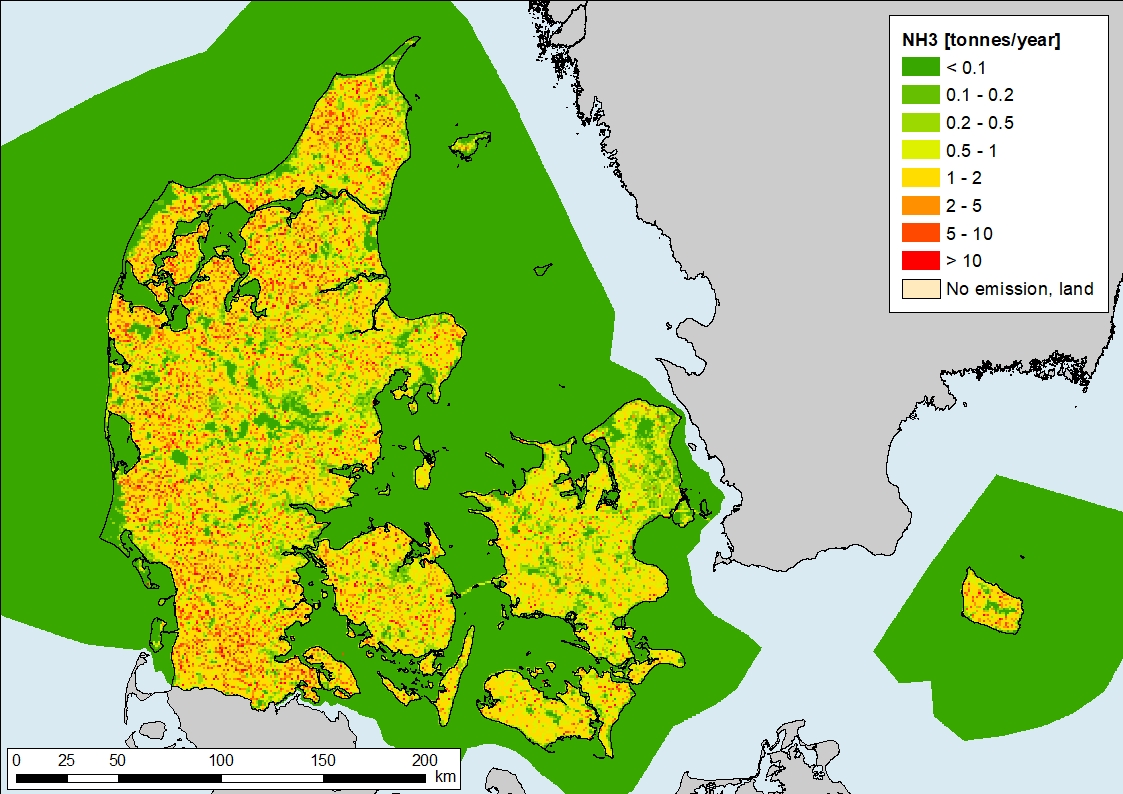
Examples of spatial distributed emissions are shown below for NOx, PM2.5 and NH3. Road traffic and other mobile sources contribute significantly to the national total NOx emission, and following, the traffic networks are conspicuous on the map. The largest PM2.5 emission source is residential combustion plants, followed by the transport sector. Residential combustion occur where people lives and following, the larger urban areas are visible on the map, as is the transport network though to a less degree than on the NOx map. Agriculture is by far the dominant source of NH3. The major source being livestock manure in the housing systems and the second largest source being agricultural soils (fertilizer, manure and crops on the fields). The NH3 map show that most agricultural emissions occur in Jutland where most livestock farming is located.
Figure 1 Maps of spatial distributed emissions from SPREAD showing national total emissions in 2021 for NOx, PM2.5 and NH3