In order to get access to the latest data on nitrogen deposition to natural areas you will need to use national environmental portal.
If you want an overview of air pollution data on national environmental portal, you can view the article http://dce.au.dk/aktuelt/nyheder/nyhed/artikel/dce-leverer-landsdaekkende-luftdata-til-miljoeportalen/
Otherwise, you can go to www.miljoeportalen.dk
(from which you must advance to the Danish area information arealinformation.miljoeportal.dk/distribution/)
Older data
Here is access to the results from the calculation of nitrogen deposition for selected natural areas for the following years:
Carried out detailed calculations using. model APRIL-DEP. Model calculates the dry deposit of ammonia to an area at 16 km x 16 km around the selected scenery area.
You can read more details by clicking on one of the years.
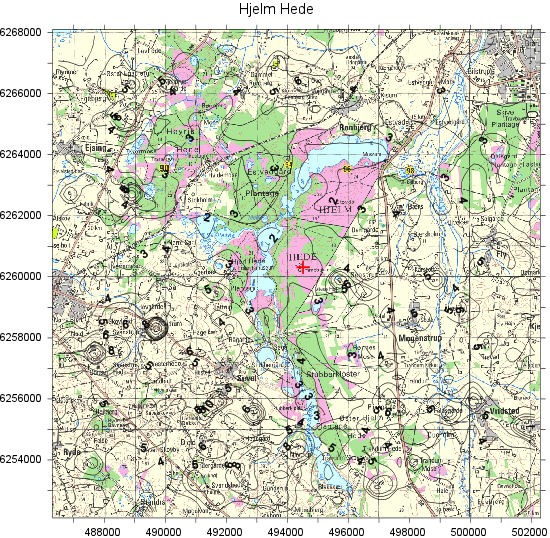
The results are obtained in the form of tables and map in the style of the display. Note that dry deposition derived from ammonia -as displayed on the maps-represents only a small part of the total nitrogen deposition.