The LULUCF sector cover emission estimates from Land Use, Land Use Change and Forestry. The majority relates to gains and losses of carbon in organic matter. The inventory methodology for LULUCF is based on a land mapping (the land use matrix) of Denmark into the six IPCC land use classes: Forest land, Cropland, Grassland, Wetlands, Settlement and Other Land.
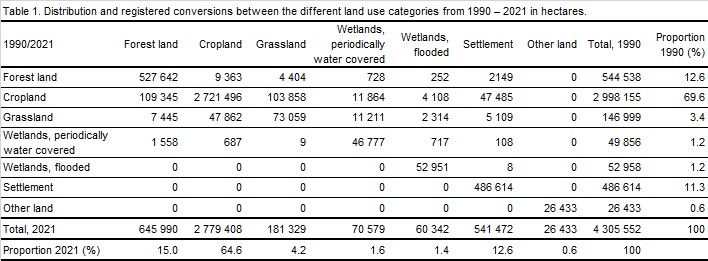
Denmark is a country intensively utilized for agricultural production, where most of the area is affected by agriculture. In 2021 approximately 65 per cent or 2.8 million hectares of the total Danish land area is cultivated as Cropland and 15 per cent is forested. In combination with a high number of cattle and pigs there is a high environmental pressure on the landscape. To reduce the impact policy measures have been adopted to protect the environment and mitigate greenhouse gas emissions. The distribution and registered changes in the different land use categories from 1990 – 2021 is presented in Table 1.
The emissions are the product of this distribution between land use categories and the conversions between them. The land use matrix is updated annually with new information from public registers, maps etc., identifying the annual land use changes taking place from one category to another, caused by e.g. afforestation projects, the need for more urban Settlements and infrastructure or efforts to restore wetlands. Aside from emissions from the main land use categories, the minor emission sources of harvested wood products and biomass burning (fires) are also included in LULUCF.
In 2021 LULUCF was estimated to be a net source of emissions at 2 420 kt CO2 equivalents or 5.2 % of the total reported Danish emission. Figure 1 presents the historical emissions from LULUCF from 1990 – 2021 from the different land use categories along with the total net emissions. The average net emission in the last five years from 2017-2021 was 2 828 kt CO2 eqv., which corresponds to close to 59 % reduction from the base year of 1990, but there are large yearly variations in the sector, since it is highly impacted by e.g. varying climatic conditions affecting the biological factors of growth, decomposition, yield etc. The majority of all emissions are CO2 as N2O and CH4 combined make up around 13.7 % of the 2021 emissions.

LULUCF reports on the following greenhouse gases:


The total area with forest in 2021 has been estimated to 645 990 hectares covering 15 % of the land area. Of this area a total of 544 538 hectares were planted before 1990. 1990 to 2021 afforestation has taken place on 118 348 hectares and deforestation on 16 896 ha. A large part of the deforestation is conversion of areas with Christmas trees (defined in the matrix as Forest land) into Cropland, as part of the usual crop rotation and removal of forests on sandy heathland converting them into Grassland.
The Danish forests have been estimated to be a net sink of 2921 kt CO2 eqv. in 2021. The forests have been a sink of around 3 000 kt CO2 eqv. annually in the last 10 years. The emission inventory for Forest land and harvested wood products is conducted by the Department of Geosciences and Natural Resource Management (IGN), at University of Copenhagen. The methodology and detailed information on the emissions from these sources are reported in the National Forest Inventories (opens new window).
Cropland is defined as land intensively utilized for agricultural purposes and includes arable and tillage land, and agroforestry systems, where vegetation falls below the thresholds used for the forestland category. Grass which is part of a frequent agricultural rotation cycle is included in the Cropland category, whereas the Grassland category includes heath, rangelands and grazing land that is outside rotation and therefore not considered Cropland. In total the area with Cropland and Grassland covers 69 % of the Danish territory, with approximately 2.8 million and 180 000 hectares respectively.
Cropland is ranging from being a net source of 5 314 kt CO2 eqv. in 1990 to a net source of 2 759 kt CO2 eqv. in 2021.The major reason for the decrease in emissions is an increased input of organic matter to the mineral soils (e.g. straw and increased area with catch crops) and a reduction of the area cultivated on organic soils. Grassland emissions have stayed relatively stable since 1990 and in 2021 contribute with emissions of 2 315 kt CO2 eqv. Compared to 2 244 in 1990.
Restoration of Wetlands on organic soils help to decrease the emissions, but cultivation and drainage of organic soils within Cropland and Grassland continues to be the main source of emissions in the sector, amounting to 4792 kt CO2 eqv. in 2021, see Figure 3. Emissions from organic soils is almost double the net emissions of the entire sector, where you count in the sink effect of the forests, and they equal about 10% of national emissions incl. LULUCF.

Wetlands is sub-divided into flooded wetland (permanently water covered) and periodically water covered wetland. Periodically water covered area includes peat excavation areas on organic soils, the drainage of which was affecting around 800 hectares in 2021.
The emission from Wetlands have decreased over the years due to a decrease in peat extraction activities in Denmark. Restoration of former wetlands primarily on Cropland and Grassland increase CH4 emissions from Wetlands. In 2021 the emissions from Wetlands were 90 kt CO2 eqv, similar to 1990 emissions of 105 kt CO2 eqv.
Settlements cover a slightly increasing area of the land use matrix, in 2021 estimated at 12.6 % of the Danish area, at 541 472 hectares. The land use category is a relatively small source of emissions, which primarily stem from conversions of Cropland and Grassland to Settlements and the associated loss of living biomass and carbon stock in the soil. The emissions in 1990 were estimated at 467 kt CO2 eqv., in 2021 reduced to 232 kt CO2 eqv.
Other land is defined as land with little or no vegetation and consequently no or very limited carbon stocks. The land use type includes beaches and sand dunes and a very small insignificant area with rocks and cliffs, in total estimated to 26 433 hectares. As the area is kept constant in the land use matrix over the entire period of the inventory, no land use changes and hence no emissions are reported.
Emissions from biomass burning (fires) in Denmark are negligible, around or below 1 kt CO2 eqv. For the entire period of the inventory from 1990 - 2021.
Some background information can be found here:
