Fugitive Emissions from Fuels is a sub-sector in the Energy Sector. In the Danish emission inventory system fugitive emissions are treated in separate models. Fugitive Emissions from Fuels include emissions from five main groups of sources;
The most important pollutants in the fugitive sector are NMVOC, SO2 and CH4. The fugitive sector makes up 6 % of the national emission of NMVOC in 2021. The corresponding percentage of SO2 and CH4 are 5 % and 1 %, respectively.
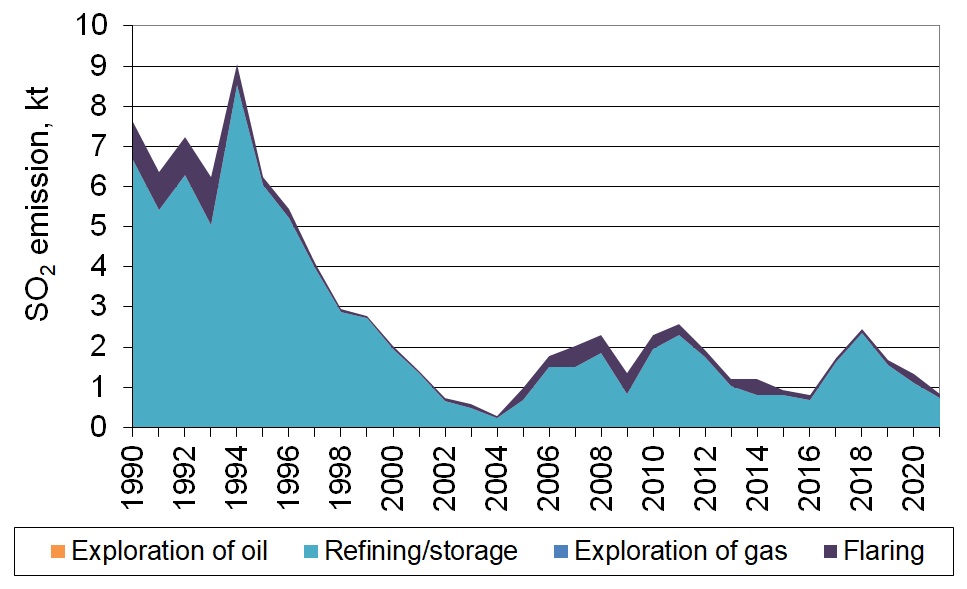
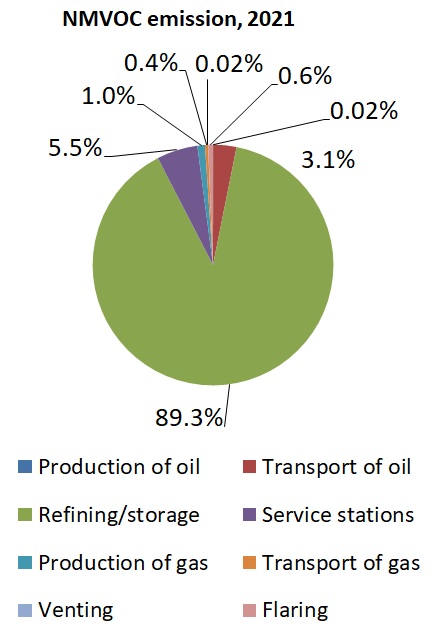
In 2021, fugitive emissions from oil account for 98 % of the sectoral NMVOC emission and 47 % of the sectoral CH4 emission. Fugitive emissions from refineries account for 87 % of the NMVOC emission and 39 % of the CH4 emission. The two major fugitive sources of fugitive SO2; refineries and flaring contributing 87 % and 17 % in 2021.
Figure 1 Distribution of the fugitive emission of NMVOC and CH4 for 2021.
 |  |
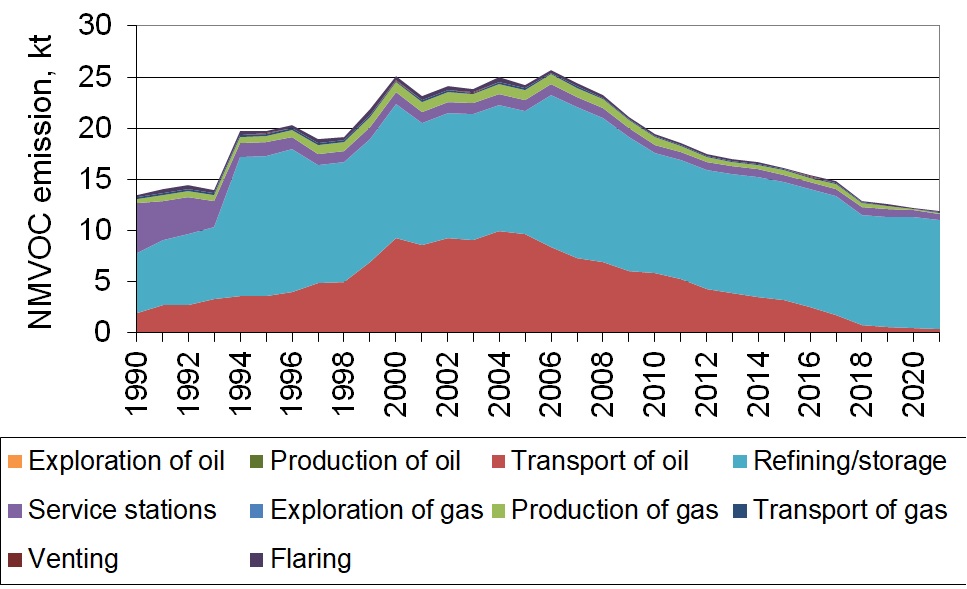
The sectoral emission of NMVOC has been increasing from 1990 to 2005 followed by a decreasing trend. Since 1990 the total fugitive emissions of NMVOC has decreased by 12 %, mainly due to decreasing emission from transport of oil in the later part of the time series. Offshore loading was introduced in 1999, which generates an increase of the total emission of NMVOC. The emission from offshore loading varies from year to year and is an important source for the NMVOC emission trend. Five major offshore oil and gas production platforms were completed in the late nineties, which is the main reason for the increased oil production and thereby the increase in the fugitive emissions from oil. The decrease in the NMVOC emission from service stations in the first years of the time series owe to introduction of new vapour control technologies, both related to transfer of gasoline from tanker truck to storage tanks at the service stations (stage IB) and from storage tanks to cars’ fuel tanks (stage II). The emission decrease from the oil terminal owe to introduction of new degassing technology in 2009, and emission decrease from onshore lading of oil at the harbour terminal owe to installation of new vapour recovery units in 2006 and 2017.
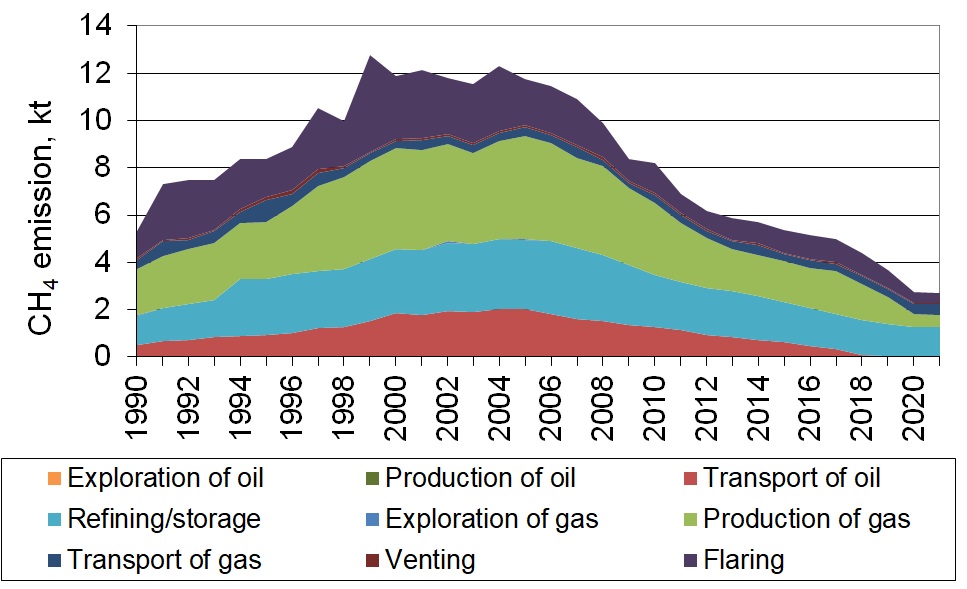
The total fugitive emissions of CH4 has decreased by 49 % since 1990. The sectoral emission of CH4 has been increasing from 1990 to 2004 followed by a decreasing trend. The increase mainly owe to increasing oil and gas production on the North Sea, which again is reflected in the emissions from extraction, from transport of oil and from the oil terminal and the refineries. The decrease in the later years owe to decreasing emissions from the oil terminal due to technological improvements and decreasing gas production.
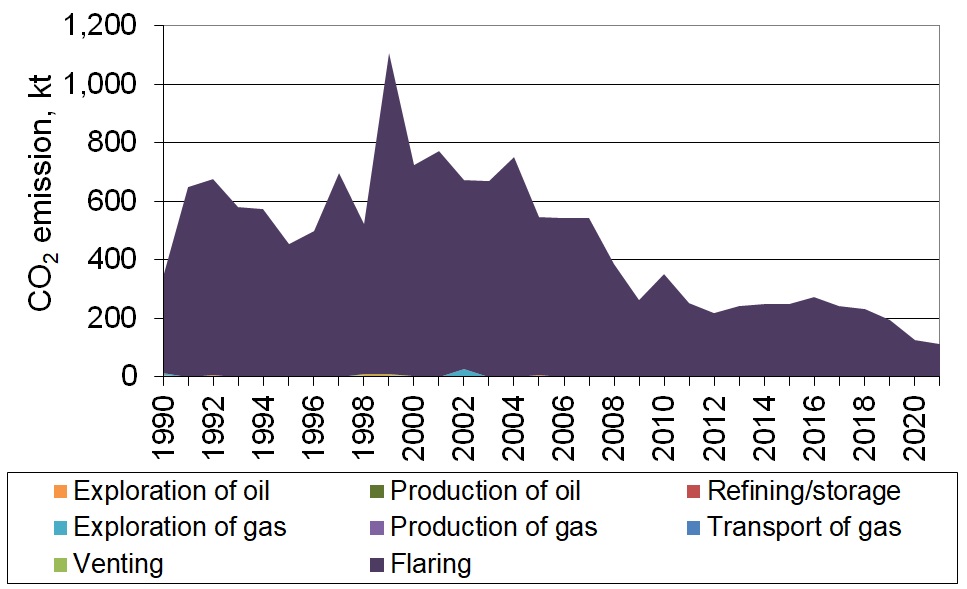
Figure 2 Time-series for fugitive emissions of NMVOC, CH4, SO2 and CO2 per sector (a, b, c and d) and total fugitive emissions (e).
a) | b) | |
c) | d) | |
e) |
The fugitive emission inventory is based on data for the oil/gas industry given in environmental reports, annual reports and on additional information gathered from the companies. Further, activity data, emissions and calorific values from the EU Emission Trading Scheme (EU ETS) are used. Other data sources are the Energy statistics and annual reports on the Danish Oil and Gas Production from the Danish Energy Agency, and gas quality data from Energinet.dk.
In cases where data on emissions are not available, the emissions (E) are calculated as activity data (AD) multiplied by the corresponding emission factor (EMF). The emission factors are based on international literature or default values given in international inventory guidelines (EMEP/EEA Emission Inventory Guidebook, IPCC Guidelines for national greenhouse gas inventories).
For a more detailed description of the data and methodology for the inventory of fugitive emissions, see the report, “Emission Inventory for Fugitive Emissions in Denmark”.